🚨
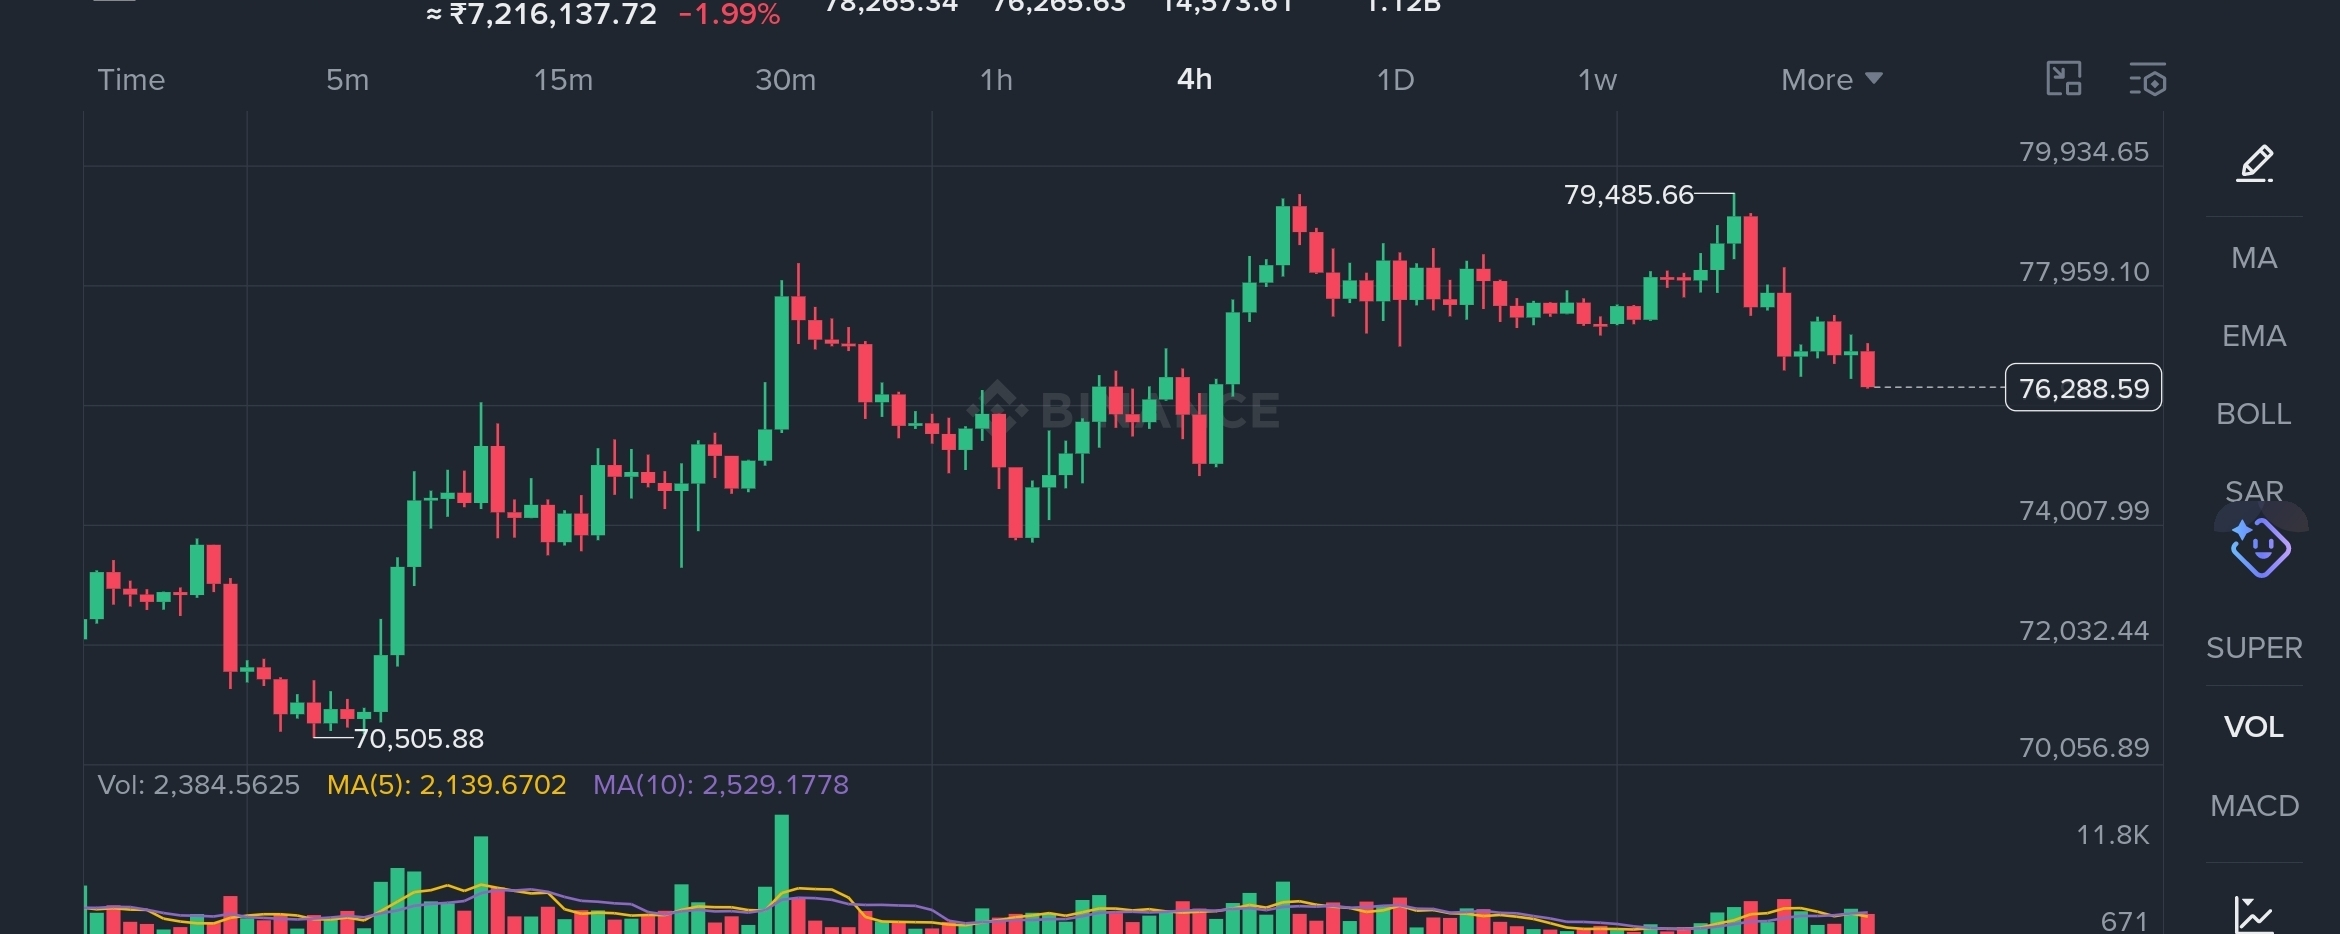
📊 Chart: BTC/USDT | Timeframe: 4H | Exchange: Binance
Current Price: $76,288.59 | 24H Change: -1.99%
📉 Market Structure Analysis
Bitcoin has printed a clear bearish reversal on the 4H chart after failing to sustain above the $79,485 resistance zone. Price has now dropped nearly $3,200 from its recent swing high, breaking below key support levels with increasing bearish momentum.
The structure tells a clean story:
✅ Strong rally from $70,505 low → peak at $79,485
❌ Failed to break $80,000 psychological resistance
🔻 Now printing Lower Highs + Lower Lows — classic bearish shift
🔍 Key Levels To Watch
Level
Type
Significance
$79,485
Resistance
Recent swing high — must reclaim
$77,959
Resistance
Previous support, now flipped
$76,288
Current Price
Active battleground
$74,007
Support
First major demand zone
$72,032
Strong Support
Critical structure level
$70,505
Major Support
Swing low — last line of defense
📊 Volume Analysis
Volume indicator shows:
MA(5): 2,139 currently below MA(10): 2,529
Selling volume has increased on recent red candles
Buying volume shrinking — bulls losing conviction
This is a bearish volume divergence — price needs strong volume surge to recover
🎯 TRADE SIGNAL
🔴 SELL SIGNAL (Short-Term Bearish Bias)
Signal : SELL / SHORT
Entry : $76,300 – $76,500 (current zone)
Stop Loss : $77,200 (conservative)
Target 1 : $74,007
Target 2 : $72,032
R:R Ratio : 1:2.8 (favorable)
Bias : Bearish
Timeframe : 4H swing trade
🟢 BUY SIGNAL (Counter-Trade — Only If Support Holds)
Signal : BUY (conditional)
Entry : $74,000 – $74,200 (demand zone)
Stop Loss : $72,800
Target 1 : $76,500
Target 2 : $78,000
Condition : Wait for 4H bullish rejection candle
+ volume confirmation at $74K
🧠 Smart Money Perspective
Institutions swept buy-side liquidity above $79,000 before reversing hard. This is a textbook liquidity grab + distribution pattern. Smart money is likely:
🏦 Distributing positions accumulated at $70,500 lows
🎯 Targeting retail stop losses below $75,000–$74,000
🔄 Planning re-accumulation in the $72,000–$74,000 demand zone
⚠️ Risk Factors To Monitor
🇺🇸 US Macro Data — Any surprise Fed news can spike volatility
📰 Crypto regulation headlines — Watch for SEC/policy updates
🐋 Whale movements — Large BTC transfers to exchanges = bearish signal
📉 BTC Dominance — If dominance drops, altcoin bleed follows
🔮 Scenarios This Week
Bearish Case (60% probability):
BTC fails to reclaim $77,500 → drops to test $74,000 → possible breakdown to $72,000
Bullish Case (40% probability):
BTC holds $75,500–$76,000 strongly → reclaims $77,959 → attempts retest of $79,485
💡 Trader's Checklist
[ ] Do NOT buy at current price without confirmation
[ ] Wait for $74,000 zone for safer long entries
[ ] Set alerts at $75,000 (breakdown) and $77,500 (recovery)
[ ] Use max 1–2% portfolio risk per trade
[ ] Keep 30–40% cash ready for dip accumulation
⚡ This analysis is for educational purposes only. Always do your own research (DYOR). Crypto markets are highly volatile — never invest more than you can afford to lose.
#Bitcoin #BTC #BTCUSDT #CryptoSig nal #BinanceSquare #TechnicalAnalysis #SmartMoney #CryptoTrading