
◆◆◆◆◆◆◆◆◆◆◆◆◆◆◆◆◆◆◆◆◆◆◆◆
➤ If you've been watching your ETH portfolio bleed in silence, you're not alone.
➤ ETH was trading above $2,463 just weeks ago.
➤ Today it sits at $1,862.
➤ That's not a normal dip. That's a structural breakdown.
➤ Every serious trader needs to understand exactly what's happening before making their next move.
═════════════════════════
◆ TECHNICAL ANALYSIS — WHAT THE CHART IS TELLING US
═════════════════════════
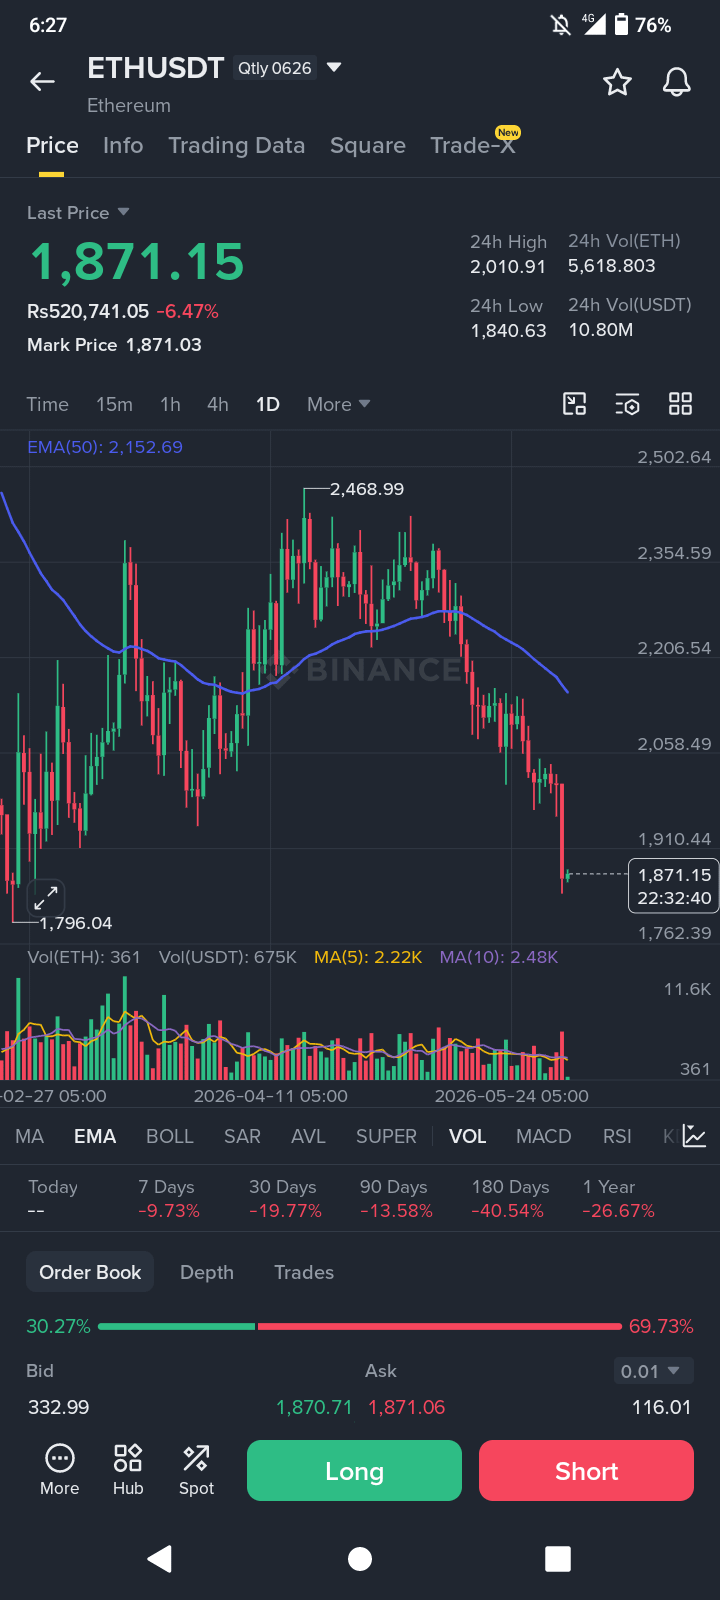
① THE MA(50) DEATH SIGNAL
➜ MA(50) currently sits at $2,218.
➜ Price remains well below the 50-day moving average.
➜ ETH has failed to reclaim this level for weeks.
✔︎ This remains a bearish market structure.
✔︎ Until price closes above MA(50), rallies remain vulnerable to selling pressure.
═════════════════════════
② LOWER HIGHS & LOWER LOWS
➜ Since the April peak at $2,463, ETH has continued printing lower highs.
➜ Lower lows continue to appear across the daily timeframe.
✔︎ This confirms a textbook downtrend.
✔︎ Market structure remains broken.
═════════════════════════
③ 24-HOUR PRICE STRUCTURE
➜ 24H High: $2,005.93
➜ 24H Low: $1,837.32
➜ Current Price: $1,862.12
➜ 24H Change: -6.74%
✔︎ Price remains close to daily lows.
✔︎ Sellers currently control momentum.
═════════════════════════
④ VOLUME BREAKDOWN
➜ Volume MA(5): 726K
➜ Volume MA(10): 849K
➜ Current volume remains below recent averages.
✔︎ This does not look like panic capitulation.
✔︎ Instead, it resembles slow institutional distribution.
✔︎ Large players may be reducing exposure without triggering mass panic.
═════════════════════════
⑤ PERFORMANCE ACROSS TIMEFRAMES
➜ Today: +0.18%
➜ 7 Days: -8.00%
➜ 30 Days: -20.63%
➜ 90 Days: -10.14%
➜ 180 Days: -38.35%
✔︎ Six months of persistent weakness.
✔︎ This appears to be a sustained bearish phase rather than a temporary correction.
═════════════════════════
◆ KEY SUPPORT & RESISTANCE LEVELS
═════════════════════════
➤ Immediate Support: $1,837
➤ Critical Support Zone: $1,763 – $1,800
➤ Key Resistance: $2,088
➤ Major Resistance: $2,218
✔︎ Bulls need a strong close above $2,088.
✔︎ Reclaiming $2,218 would significantly improve market structure.
✔︎ A breakdown below $1,763 could expose the $1,500 region.
═════════════════════════
◆ FUNDAMENTAL REASONS BEHIND THE DROP
═════════════════════════
① ETF OUTFLOWS
➜ Spot Ethereum ETFs have experienced persistent outflows.
➜ Institutional demand remains weak.
✔︎ Large capital flows continue moving away from ETH.
═════════════════════════
② GROWING COMPETITION
➜ Alternative trading and DeFi ecosystems continue gaining market share.
➜ Ethereum's dominance is increasingly challenged.
✔︎ Markets are repricing competitive risks.
═════════════════════════
③ WEAKER BUYER DEMAND
➜ Major treasury accumulation has slowed.
➜ Large-scale buying activity remains limited.
✔︎ Reduced demand creates additional pressure on price.
═════════════════════════
④ HISTORICAL SEASONALITY
➜ June has historically been one of ETH's weaker months.
✔︎ Seasonal weakness adds another bearish factor.
═════════════════════════
⑤ BEARISH CHART PATTERNS
➜ Higher timeframe structure suggests continuation risk.
➜ Key support levels remain under pressure.
✔︎ Failure of support could accelerate downside momentum.
═════════════════════════
◆ WHAT SHOULD TRADERS DO?
═════════════════════════
✔︎ Avoid buying solely because ETH appears cheaper.
✔︎ Wait for confirmation rather than anticipation.
✔︎ Watch for a decisive close above $2,088.
✔︎ Define risk before entering any trade.
✔︎ Monitor the $1,837 level closely.
✔︎ Respect the prevailing trend.
➜ The trend remains bearish until proven otherwise.
═════════════════════════
➤ Ethereum remains one of the most important blockchain ecosystems in the world.
➤ Long-term development continues.
➤ Future upgrades may improve network activity and sentiment.
✔︎ However, markets currently care more about liquidity, momentum, and price structure.
✔︎ Right now, those factors remain bearish.
➜ Trade what the market is showing.
➜ Protect capital.
➜ Stay patient.
➜ Wait for confirmation.
═════════════════════════
💬 ARE YOU BULLISH OR BEARISH ON ETH RIGHT NOW?
➤ Where do you think the bottom is?
➤ Share your target in the comments.
➤ Follow for daily market breakdowns.
◆◆◆◆◆◆◆◆◆◆◆◆◆◆◆◆◆◆◆◆◆◆◆◆
