
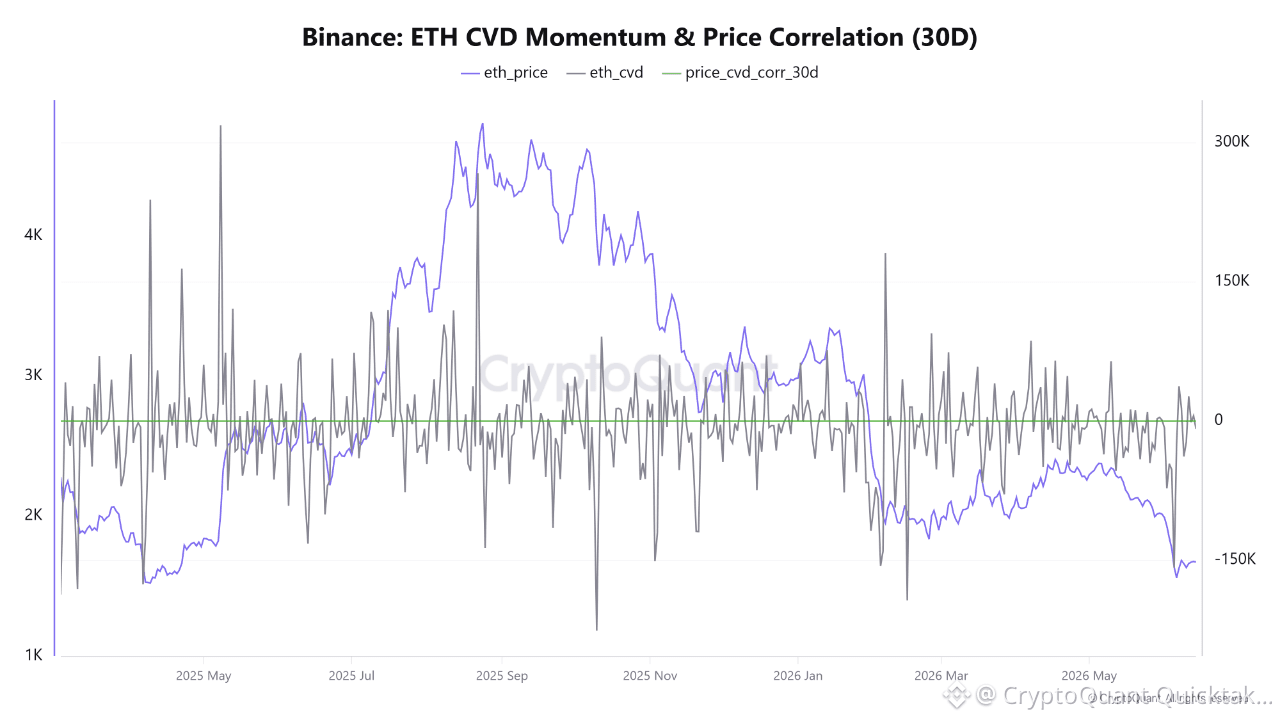
Data from the ETH CVD Momentum indicator on Binance shows a significant recent decline in Ethereum’s performance, coinciding with the coin’s price dropping to around $1,670. The chart shows that the Cumulative Volume Delta (CVD) indicator recorded a deep negative reading of approximately -8,400 ETH, reflecting the current dominance of sell orders over buy orders.
The data also indicates that Ethereum’s price remained above $2,200 during April and May, despite constant fluctuations in the CVD indicator. However, the beginning of June witnessed a clear change in trend, with the price falling sharply in conjunction with a strong drop in the indicator to its lowest level during the period under review. This simultaneous decline in both price and CVD reflects an increase in actual selling pressure in the market, rather than merely short-term fluctuations.
Furthermore, the 30-day moving correlation between price and CVD has stabilized near the positive zone at around 0.82, indicating a relatively strong relationship between price movement and changes in buy and sell order flows. This means that CVD movements are now having a greater impact on price direction than in previous periods.
From a market perspective, these data reflect continued caution among traders on Binance, where selling pressure still outweighs buying demand. If the indicator continues to register negative readings, Ethereum may remain vulnerable to further volatility and downward pressure. A return of the CVD to an upward trend could be an initial sign of improved risk appetite and the return of buyers to the market, which could support price stabilization or the start of a new recovery phase.
Written by Arab Chain