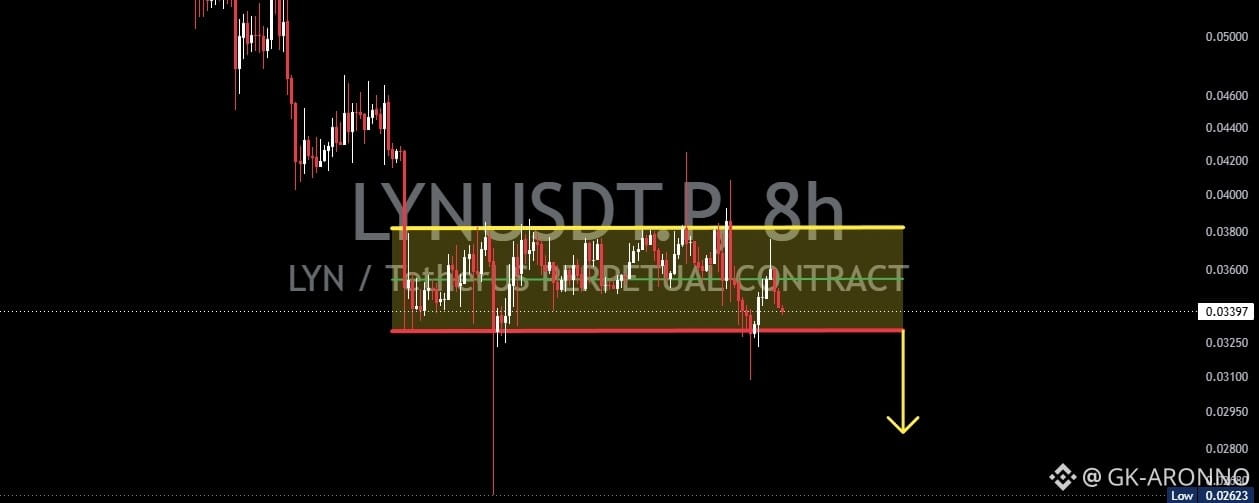

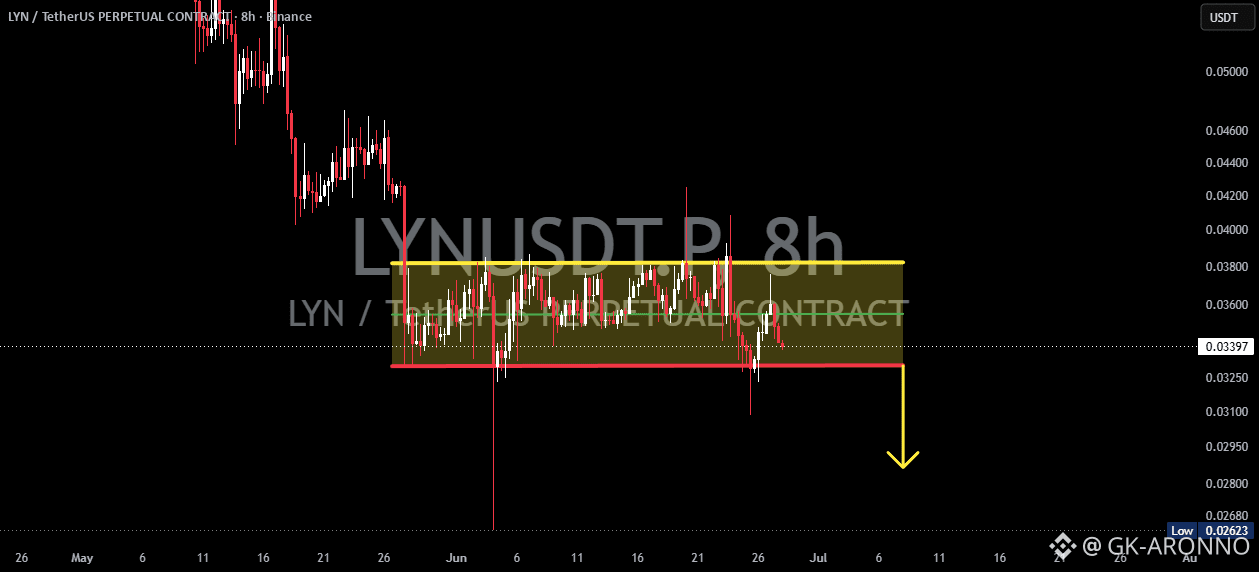
📊 On the 8-hour timeframe, LYNUSDT Perpetual is trading inside a well-defined Bearish Rectangle after experiencing a strong impulsive decline. This pattern represents a consolidation phase where buyers and sellers are temporarily balanced, but since it forms after a significant downtrend, the probability generally favors a continuation to the downside.
📌 Price has repeatedly tested both the upper resistance and lower support of the rectangle without establishing a sustained breakout. This indicates that the market is still waiting for confirmation before making its next major move.
⚠️ At the moment, price is hovering very close to the lower boundary of the rectangle, making this an important decision zone.
---
📊 Pattern Explanation: Bearish Rectangle
A Bearish Rectangle is a continuation pattern that develops after a strong bearish move.
🔍 Pattern Characteristics:
✅ Strong bearish impulse before consolidation.
📉 Price moves sideways within horizontal support and resistance.
🚫 Multiple rejections at resistance.
📊 Buyers fail to create higher highs.
🐻 Selling pressure gradually dominates.
💥 This pattern usually ends with a breakdown below support, continuing the previous bearish trend.
---
🐻 Bearish Scenario (Primary Bias)
📌 The bearish outlook remains valid as long as price stays below the rectangle resistance.
✅ Confirmation:
🔻 Daily/8H candle closes below the horizontal support (red line).
📉 Breakdown is accompanied by increasing selling momentum.
🔄 Former support turns into new resistance during any retest.
🎯 Potential Outcome:
📉 Continuation of the previous downtrend.
💥 Increased selling pressure.
📍 Possibility of forming new swing lows.
➡️ As shown on the chart, the projected move targets the 0.0290–0.0280 area, although traders should still monitor price action and volume for confirmation before assuming the move is complete.
---
🐂 Bullish Scenario (Invalidation)
⚠️ The bearish setup becomes weaker if buyers successfully reclaim the upper boundary of the rectangle.
✅ Bullish Confirmation Requires:
🚀 Strong breakout above horizontal resistance.
🟢 8H candle closes above resistance.
🔄 Successful retest of the breakout level as new support.
📈 Increased buying volume.
💡 If these conditions occur, the bearish rectangle would fail, opening the possibility for a broader recovery toward the next resistance levels.
---
🎯 Key Levels
🟢 Resistance
📍 Rectangle upper boundary around 0.0380
🔴 Support
📍 Rectangle lower boundary around 0.0330
⚠️ Breakdown Zone
📉 A confirmed close below support may trigger the next bearish continuation.
---
⚠️ Trading Notes
✅ Wait for a confirmed candle close before reacting to a breakout or breakdown.
⚡ False breakdowns are common around major support zones.
🛡️ Risk management remains essential, especially during consolidation patterns.
---
📌 Conclusion
📉 LYNUSDT is currently forming a Bearish Rectangle, a classic continuation pattern after a strong decline. The market remains trapped inside the consolidation range, but sellers still hold the overall advantage while price remains below resistance.
🐻 A decisive break below the rectangle support would strengthen the bearish continuation thesis, while a breakout above resistance would invalidate the current bearish structure and shift momentum toward a bullish recovery.
$LYN