📊 CHART BREAKDOWN — WHAT THE WEEKLY TELLS US
Looking at the weekly BTCUSDT chart on Binance, the structure is telling a very clear story — and it's one of repeating cycles.
---
### 🔴 THE DESCENDING CHANNEL — A PATTERN REPEATING SINCE 2024
Since early 2024, BTC has been printing a series of descending parallel channels, each with the same structure:
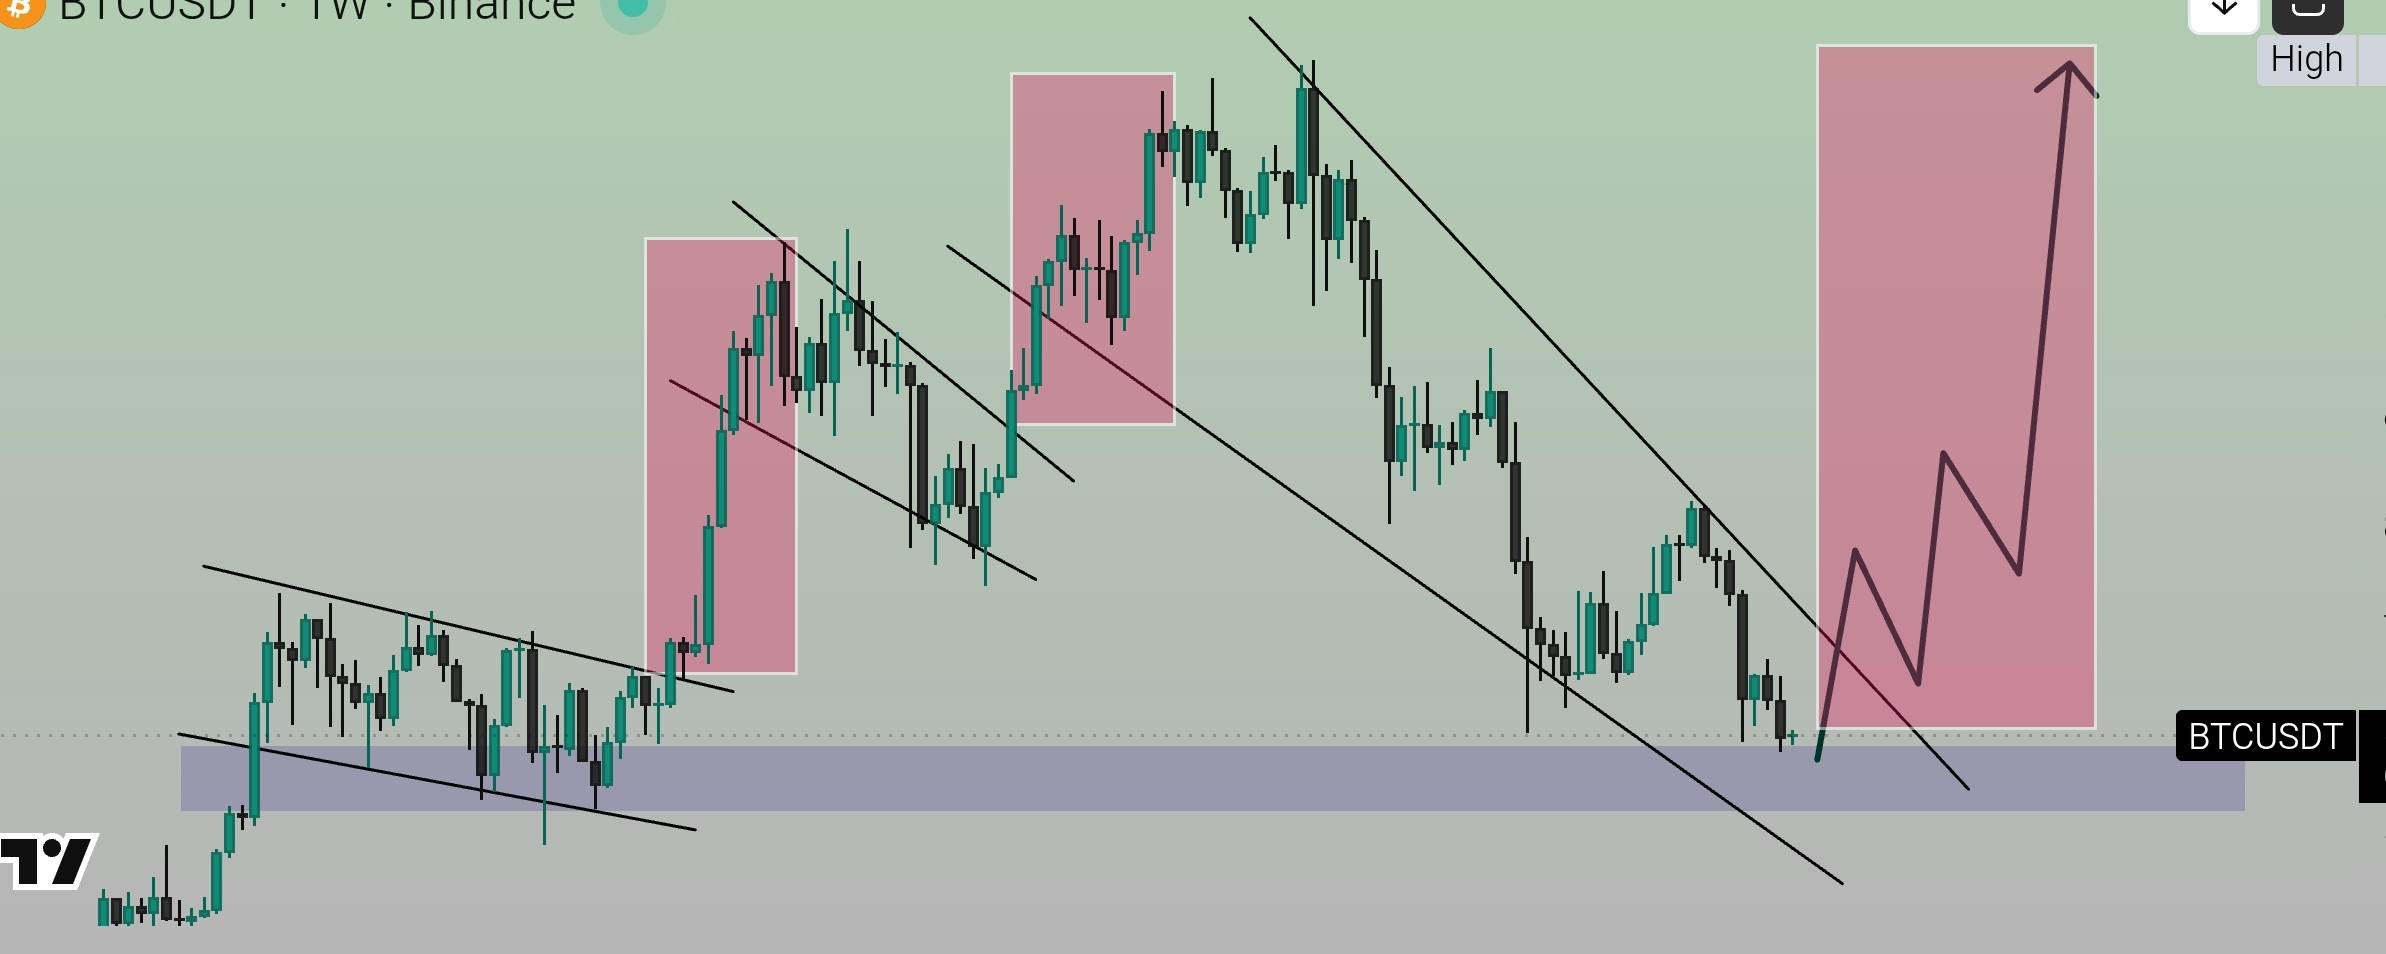
✅ Price pumps → hits the upper channel resistance (highlighted in pink zones)
❌ Gets rejected → slides down the channel
🔄 Rinse and repeat
We've now seen THREE full cycles of this on the weekly chart:
1. Cycle 1 (Mid-2024): Pump to the pink zone → channel rejection → consolidation
2. Cycle 2 (Mid-2025): Bigger pump to ~$126K ATH → channel rejection → heavy correction
3. Cycle 3 (Now — Late 2026 Projection): Price approaching the key support zone / purple band → possible final bottom before the next major move
---
### 🟣 THE PURPLE SUPPORT ZONE — THIS IS THE KEY LEVEL
The horizontal purple/blue band on the chart is the most critical zone on the entire chart. This band has acted as a major macro support since 2024 and price is now testing it for potentially the first time at this level.
BTC peaked at approximately $126,000 in October 2025 and has since entered correction mode, currently trading around $60,000 — roughly a 50% drawdown from the all-time high. [Mudrex](https://mudrex.com/learn/when-will-bitcoin-bottom-prediction/) This places BTC directly into or near that purple support band.
The $60K level has already been tested and price bounced from it, which suggests underlying demand — but analysts note that a true bottom typically forms through a process, not a single rebound. [Mudrex](https://mudrex.com/learn/when-will-bitcoin-bottom-prediction/)
---
### 📉 CURRENT MARKET STRUCTURE
On the weekly timeframe, Bitcoin appears bearish. The 50-day moving average is above the price and falling, acting as resistance, while the 200-day moving average has been rising since late 2025, which provides some longer-term structural support. [Changelly](https://changelly.com/blog/bitcoin-price-prediction/)
As of late June 2026, technical indicators are predominantly bearish, with only a small number of signals pointing bullish. The RSI sits near 31, which is approaching oversold territory — a zone historically associated with accumulation opportunities on the macro timeframe. [CoinCodex](https://coincodex.com/crypto/bitcoin/price-prediction/)
---
### 🎯 THE PROJECTED MOVE — WHAT THE CHART IS SAYING
The drawn projection on the right side of the chart shows a very specific pattern:
1. One more dip — possibly a final wick into or below the purple support band (potential sub-$58K liquidity grab)
2. A consolidation / W-bottom forming inside the pink zone
3. A strong breakout and impulse move targeting new highs into 2027
Major on-chain analytics firms and cycle experts, including CryptoQuant and Glassnode, independently point to Q4 2026 as the highest-probability bottom window, based on historical 4-year halving cycle timing. [Mudrex](https://mudrex.com/learn/when-will-bitcoin-bottom-prediction/)
The $50K–$60K range is being watched as the historically attractive long-term accumulation zone, aligning with the 200-week moving average and institutional support levels. [Mudrex](https://mudrex.com/learn/when-will-bitcoin-bottom-prediction/)
---
### 🗓️ TIMELINE OUTLOOK
| Period | Scenario |
|---|---|
| July–Sept 2026 | Final capitulation / bottom formation |
| Q4 2026 | Accumulation zone, potential trend reversal |
| 2027 | Bull cycle continuation, new ATH attempt |
---
### ⚠️ RISK FACTORS TO WATCH
- A weekly close below $58K would be a strong bearish signal and could extend the correction
- Macro conditions (Fed policy, global liquidity) remain a headwind
- BTC is currently trading well below its 20-month EMA at ~$79,979, showing that buyers have not yet reclaimed medium-term control [CoinDCX](https://coindcx.com/blog/price-predictions/bitcoin-price-weekly/)
---
### 🧠 BOTTOM LINE
The chart is painting a classic late-cycle accumulation setup. The descending channel structure, combined with the purple macro support zone and historically oversold weekly RSI, suggests we are in or very near the final bottom range before the next major bull leg.
This is not financial advice. Always DYOR and manage your risk. But if history rhymes — and in crypto it often does — the opportunity forming here is one of the most significant on the weekly chart since 2022/2023.
---
#BTC #bitcoin #BTCUSDT #CryptoAnalysis #BinanceSquare #TechnicalAnalysis #Crypto2026