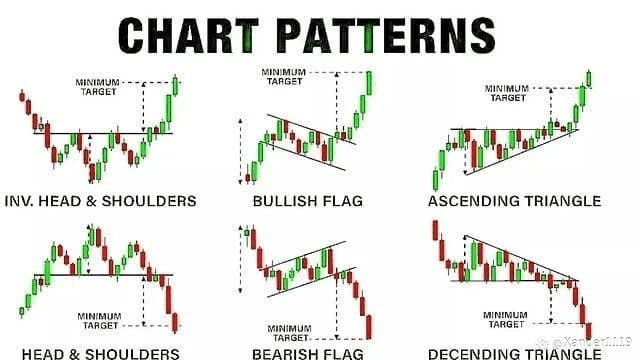
If you're serious about crypto trading these 6 chart patterns can be your edge — helping you spot 𝙧𝙚𝙫𝙚𝙧𝙨𝙖𝙡 predict breakouts and protect your capital. Let's break them down 👇
---
1️⃣ 𝙁𝙖𝙡𝙡𝙞𝙣𝙜 𝙒𝙚𝙙𝙜𝙚 ⬇️➡️⬆️ (𝘽𝙪𝙡𝙡𝙞𝙨𝙝 𝙍𝙚𝙫𝙚𝙧𝙨𝙖𝙡)
Price squeezes lower into a wedge shape.
Once it breaks upward it usually signals the start of a bullish trend.
🎯 Target: The height of the wedge added to the breakout point.
---
2️⃣ 𝙎𝙮𝙢𝙢𝙚𝙩𝙧𝙞𝙘𝙖𝙡 𝙏𝙧𝙞𝙖𝙣𝙜𝙡𝙚 🔺 (𝘽𝙪𝙡𝙡𝙞𝙨𝙝 𝘾𝙤𝙣𝙩𝙞𝙣𝙪𝙖𝙩𝙞𝙤𝙣)
Price consolidates with equal sloping support/resistance.
A breakout in the direction of the existing uptrend often follows.
⚠️ Combine with volume for stronger signals.
---
3️⃣ 𝘿𝙤𝙪𝙗𝙡𝙚 𝘽𝙤𝙩𝙩𝙤𝙢 🐂 (𝙏𝙧𝙚𝙣𝙙 𝙍𝙚𝙫𝙚𝙧𝙨𝙖𝙡)
Looks like a W — two equal lows with a peak in between.
Once price breaks above the neckline bulls are in charge.
💥 Bullish signal especially after a downtrend.
---
4️⃣ 𝙍𝙞𝙨𝙞𝙣𝙜 𝙒𝙚𝙙𝙜𝙚 ⬆️➡️⬇️ (𝘽𝙚𝙖𝙧𝙞𝙨𝙝 𝙍𝙚𝙫𝙚𝙧𝙨𝙖𝙡)
Price climbs within a narrowing wedge.
A downward breakout is a red flag.
📉 Often seen before sharp drops — take profits or hedge.
---
5️⃣ 𝙎𝙮𝙢𝙢𝙚𝙩𝙧𝙞𝙘𝙖𝙡 𝙏𝙧𝙞𝙖𝙣𝙜𝙡𝙚 🔻 (𝘽𝙚𝙖𝙧𝙞𝙨𝙝 𝘾𝙤𝙣𝙩𝙞𝙣𝙪𝙖𝙩𝙞𝙤𝙣)
Appears during a downtrend.
Price consolidates then usually breaks lower to continue the bearish move.
🚨 Watch for volume spike on breakout.
---
6️⃣ 𝘿𝙤𝙪𝙗𝙡𝙚 𝙏𝙤𝙥 🐻 (𝙏𝙧𝙚𝙣𝙙 𝙍𝙚𝙫𝙚𝙧𝙨𝙖𝙡)
M shape with two equal highs.
Breakdown below neckline = confirmed bearish signal.
🚫 Time to get cautious or consider short strategies.
---
𝙒𝙝𝙮 𝘿𝙤 𝙏𝙝𝙚𝙨𝙚 𝙋𝙖𝙩𝙩𝙚𝙧𝙣𝙨 𝙈𝙖𝙩𝙩𝙚𝙧?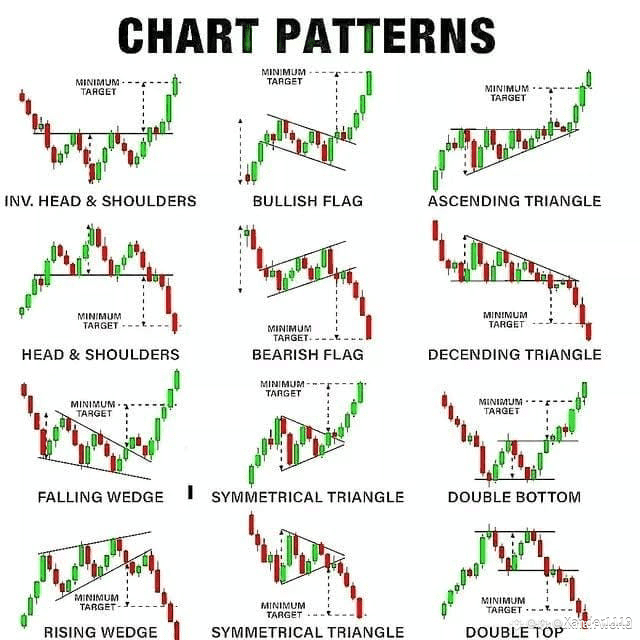
✅ Help you anticipate market moves
✅ Improve entry & exit timing
✅ Reduce emotional trades
✅ Work best with volume confirmation
---
📊 𝘾𝙝𝙖𝙧𝙩 𝙑𝙞𝙨𝙪𝙖𝙡𝙨 𝙃𝙚𝙡𝙥 𝙏𝙤𝙤:
Here's the cheat sheet image 👇
If this helped you smash ❤️ and comment PATTERNS to unlock more trading wisdom!
#cryptotrading #chartpatterns #BTCStrategy #BinanceTips #TA101 #CandlestickPatterns #CryptoEducation