
Position: LONG
( JOIN OUR LIVE FOR MORE UPDATE AND INFORMATION )
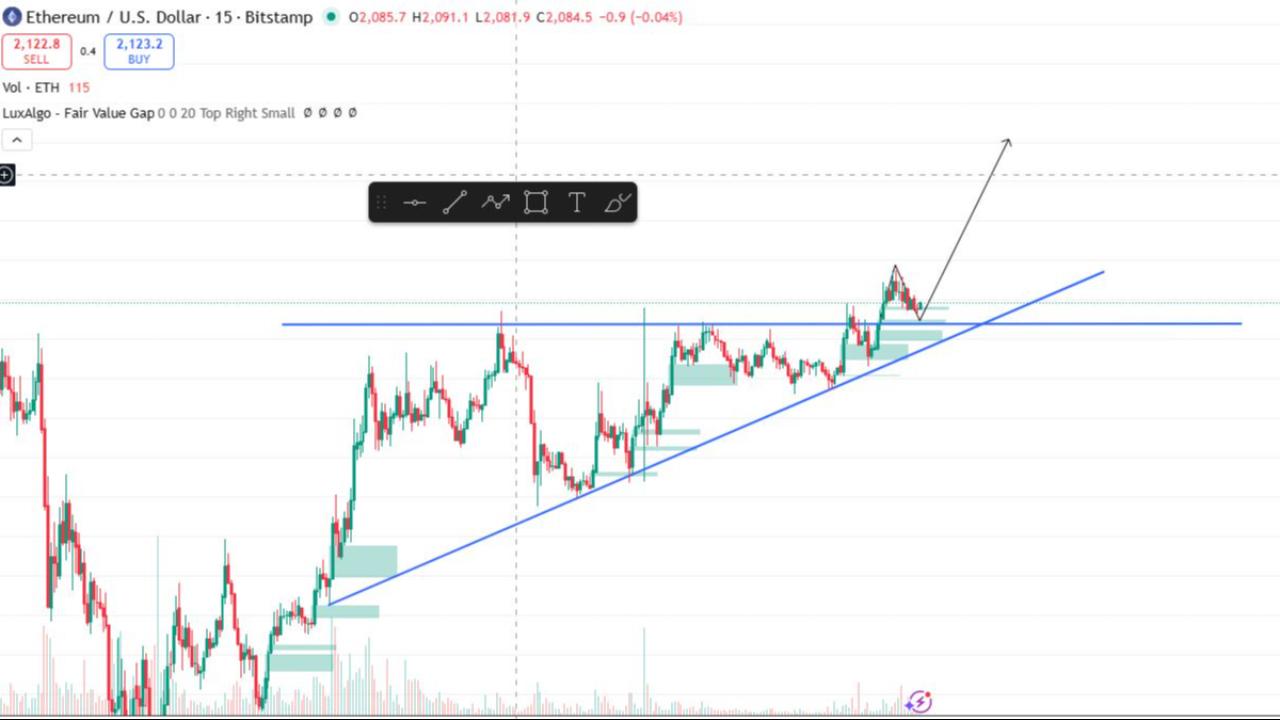
Based on the chart this is an Ascending Triangle Pattern forming on Ethereum (ETH/USD) on the 15-minute timeframe. Historically, this is a bullish continuation pattern that suggests buyers are becoming more aggressive. ETH price already broke above the $2,120 resistance level. Now we are waiting for a prefect retest. If we get our confirmation then we will take our entry with basic and needed stop loss. This is a high-probability setup because we are buying the "dip" after a confirmed breakout.
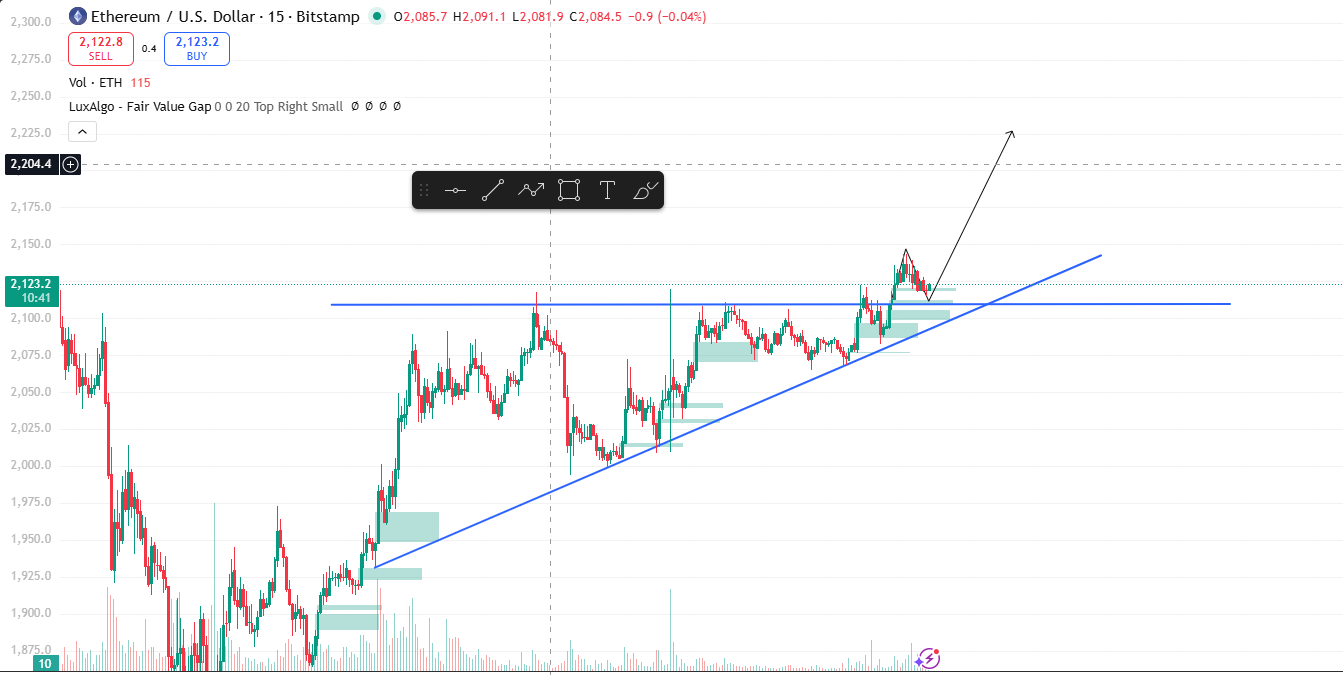
Entry Price: $2,120 - $2,115 (Current market price/retest area).
Stop Loss: $2,050
1. Target 1: $2,165
2. Target 2: $2,190
3. Target 3: $2,240
To manage this trade like a pro, once the price hits Target 1, move your Stop Loss to your Entry Price. This makes it a "risk-free" trade, allowing you to let the rest of the position run toward the higher targets without the fear of losing money.
#Write2Earn #ETH #TradeSignal