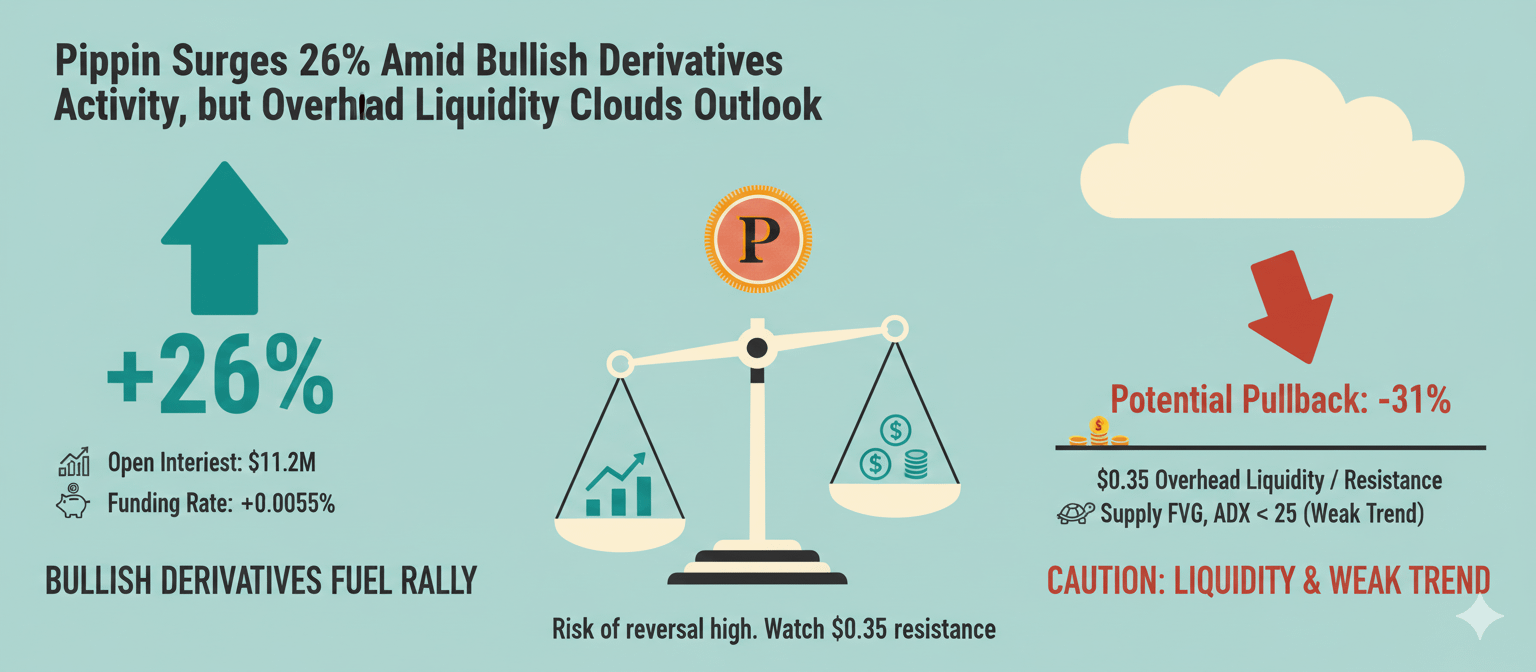
Pippin [PIPPIN] made a striking move over the past 24 hours, posting a 26% gain the largest advance across the crypto market during this period. While the rally has drawn fresh capital into the token, a closer look at derivatives and liquidity data suggests caution: the short-term upside may be fragile, and the recent surge could be setting the stage for a potential reversal.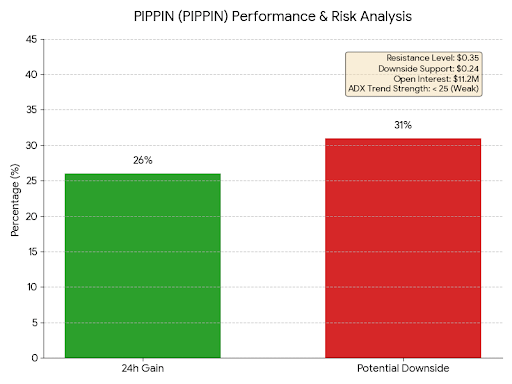
Derivatives Drive the Rally
The current rally in PIPPIN is being fueled largely by activity in its derivatives market. Open Interest (OI) has surged to around $11.2 million the highest level since January 8 signaling that fresh capital is entering the market, according to Coinalyze. For context, OI represents the total value of open futures positions across both long and short traders. When OI rises alongside the price, it often reflects growing long exposure, with bullish traders betting on further upside.
The aggregated Funding Rate also remained positive at 0.0055%, indicating that longs are paying a premium to hold their positions. This dominance of bullish positioning has undoubtedly supported the recent price advance. Yet, while derivatives activity explains the short-term surge, broader market signals hint that the rally may not be sustainable.
Liquidity Clusters Highlight Potential Resistance
A glance at PIPPIN’s liquidation heatmap reveals elevated liquidity clusters above the current price, particularly around the $0.35 mark. These clusters, where unfilled orders and leveraged positions accumulate, often act as both magnets for price and resistance points. Should PIPPIN sweep through this overhead liquidity, the rally could quickly reverse.
On the downside, a notable liquidity cluster sits near $0.24. If the token fails to sustain higher levels, a sharp drop toward this zone could follow representing a potential 31% decline from the recent peak. This scenario aligns with a classic bull trap: late entrants are drawn in during a strong upward move, only to face a swift reversal and liquidation.
Mixed Momentum Signals
Momentum indicators paint a conflicted picture. On the bullish side, the Moving Average Convergence Divergence (MACD) has formed a Golden Cross, with the MACD line crossing above the signal line, reflecting improving short-term momentum. The histogram is stabilizing, suggesting bearish pressure is easing.
However, the Average Directional Index (ADX) indicates that the strength of the move remains limited. At the time of writing, the ADX has yet to breach the 25 level a threshold typically associated with strong, sustained trends. Until the ADX confirms a robust trend, the rally should be viewed as tentative rather than a signal of broader market strength.
Adding another layer of caution, PIPPIN’s price has moved into a well-defined supply fair value gap (FVG), a zone created during prior declines and recovery attempts where selling pressure previously dominated. This inefficient pricing area could act as resistance, and a failure to hold above it may trigger further downside.
Final Thoughts
Pippin’s 26% surge highlights the power of bullish derivatives positioning and short-term momentum in driving crypto price action. However, the presence of overhead liquidity clusters and the supply fair value gap signals rising risk. Traders entering the rally now should remain cautious, as the current move could reflect temporary positioning rather than a genuine shift in market structure.
In short, PIPPIN is flashing both excitement and warning signs: a sharp upside move accompanied by elevated risk of a pullback. Watching how the token interacts with overhead resistance and liquidity clusters will be key in the next 24–48 hours.