$XVS is trading around 3.27 after a heavy weekly downtrend.
From 8.04 high → 2.49 low, structure is clearly bearish.

Now price is attempting a weak bounce.
Big question 👇
Is this recovery real… or just a lower high before the next leg down?
Let’s break it down technically.
🔎 Weekly Structure Analysis (Swing Bias)
❌ Strong downtrend (Lower Highs + Lower Lows)
❌ Price below MA(7), MA(25), MA(99)
❌ All MAs sloping downward
❌ Rejection from mid-range resistance zone
⚠ Bounce lacks strong bullish momentum
Trend is your friend — and trend is clearly bearish.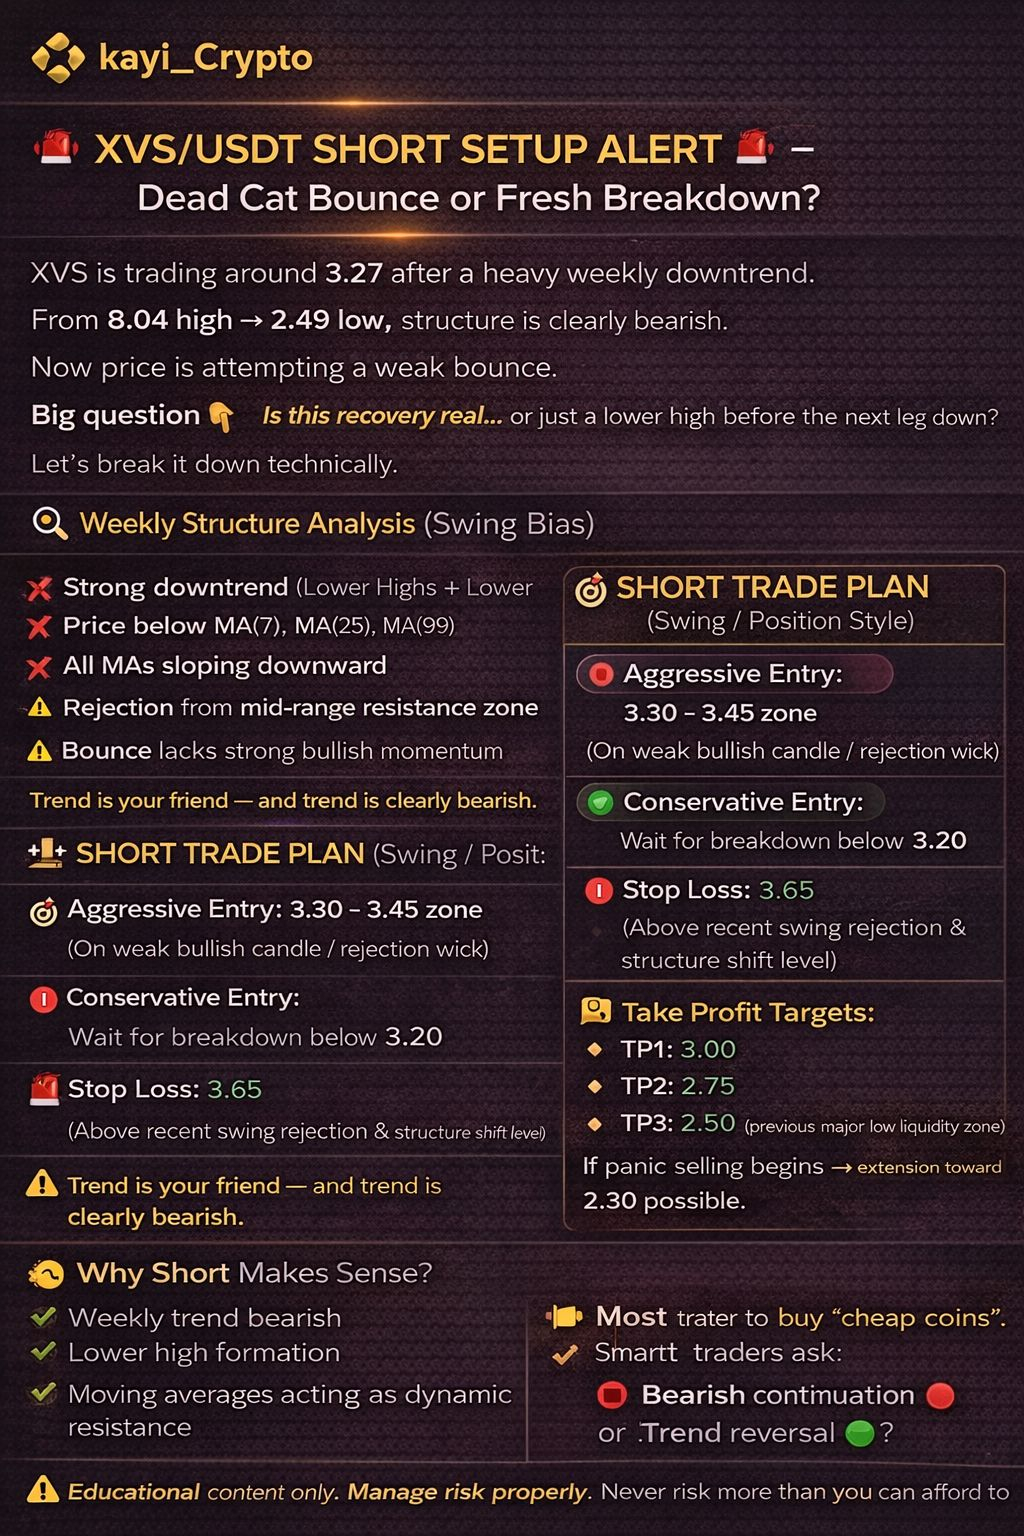
🎯 SHORT TRADE PLAN (Swing / Position Style)
📌 Aggressive Entry:
3.30 – 3.45 zone
(On weak bullish candle / rejection wick)
📌 Conservative Entry:
Wait for breakdown below 3.20
🛑 Stop Loss:
3.65
(Above recent swing rejection & structure shift level)
🎯 Take Profit Targets:
TP1: 3.00
TP2: 2.75
TP3: 2.50 (previous major low liquidity zone)
If panic selling begins → extension toward 2.30 possible.
📊 Why Short Makes Sense?
✔ Weekly trend bearish
✔ Lower high formation
✔ Moving averages acting as dynamic resistance
✔ Weak bounce after heavy drop
✔ No bullish structure break yet
⚠ Invalidation Level
If weekly closes above 3.65 – 3.80,
bearish bias weakens.
Trend reversal needs structure break — not just green candles.
🧠 Teaching Moment
Most traders try to buy “cheap coins.”
Smart traders ask:
👉 Is structure bullish?
👉 Has trend changed?
👉 Are MAs flipping upward?
Right now — answer is no.
📢 Final Question
Is XVS building a base here…
or preparing for another flush toward 2.50?
Comment your view 👇
Bearish continuation 🔴
or Trend reversal 🟢 ?
⚠ Educational content only. Manage risk properly.
Never risk more than you can afford to lose.