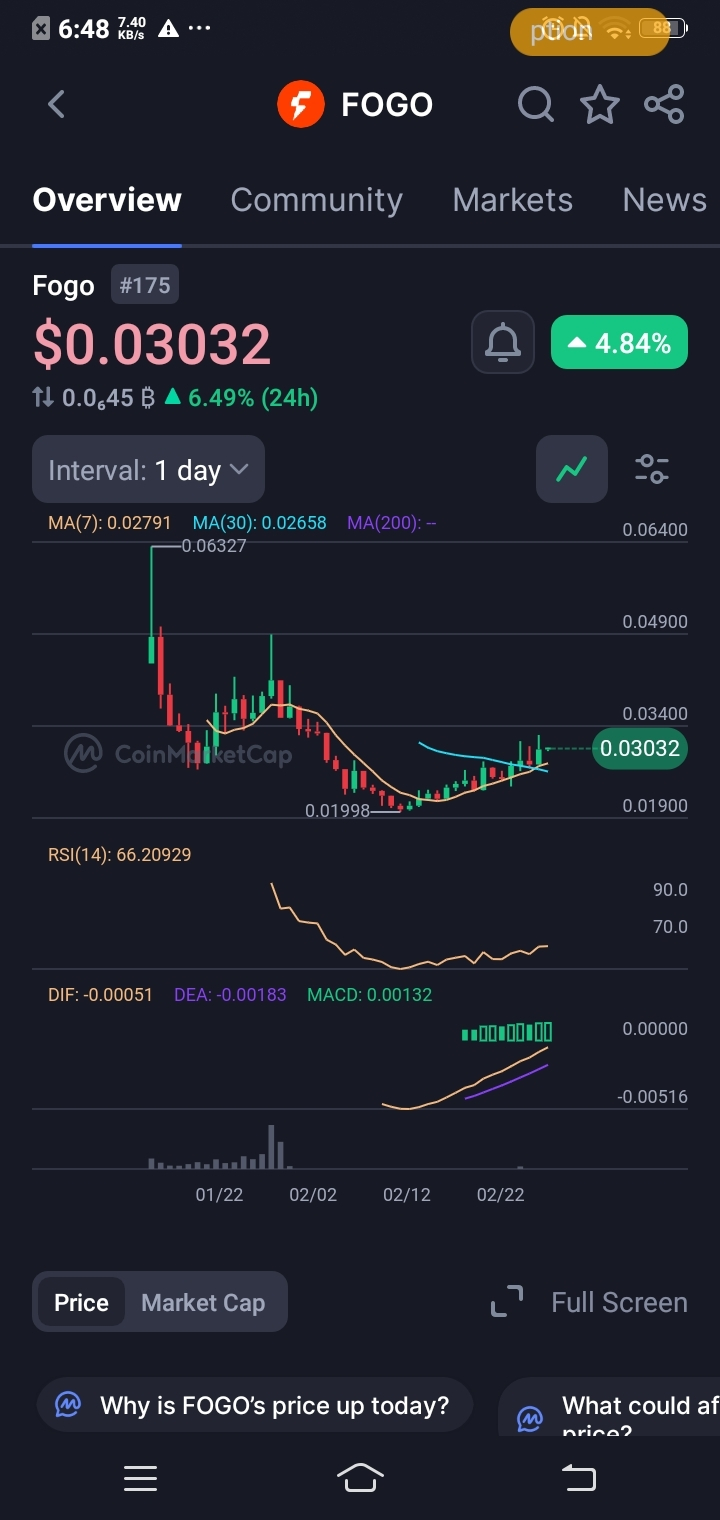
$FOGO is currently trading at $0.03032, holding firmly above both the 7-day and 30-day moving averages. After a strong move up from January lows, price is now consolidating near recent highs—suggesting a potential continuation setup.
> Why This Setup Exists
The chart shows a clear shift in structure: price broke above the MA(30) trend resistance in early February and has since been making higher lows. The current pullback is shallow, indicating sellers are not aggressive. This type of price action often precedes the next leg up if demand returns.
>Where Buyers or Sellers Are Active
Buyers have stepped in near the $0.026–$0.027 zone, which aligns with the MA(7) and prior resistance-turned-support.
Sellers are visible near the $0.034–$0.036 range, where price previously stalled. A clean break above this zone would open the door to the next liquidity cluster near $0.049.
> What Confirms the Move
RSI(14) at 66.20 – bullish momentum is intact but not yet overbought, leaving room for upside.
MACD – histogram is positive and the DIF line is curling above DEA, supporting bullish momentum.
Price holding above MA(7) on the daily timeframe adds confirmation of short-term strength.
> What Invalidates the Idea
A daily close below $0.0265 (MA(30) support) would signal weakening structure.
If RSI drops below 50 with volume selling pressure, the bullish outlook would be delayed.
>> Bottom Line:
FOGO is in a healthy uptrend pullback. Watch for a reclaim of $0.032–$0.034 to confirm the next push higher.