The fusion of traditional safe-haven assets and blockchain transparency is accelerating — and $PAXG is standing at the center of this evolution. As global uncertainty rises and fiat volatility continues, traders are quietly shifting capital toward tokenized gold exposure.
Backed by physical gold reserves, Paxos Gold (PAXG) represents real gold stored in secure vaults, offering both stability and digital liquidity. Unlike speculative altcoin swings, PAXG moves in sync with Gold (XAU) — but with the speed and flexibility of crypto markets.
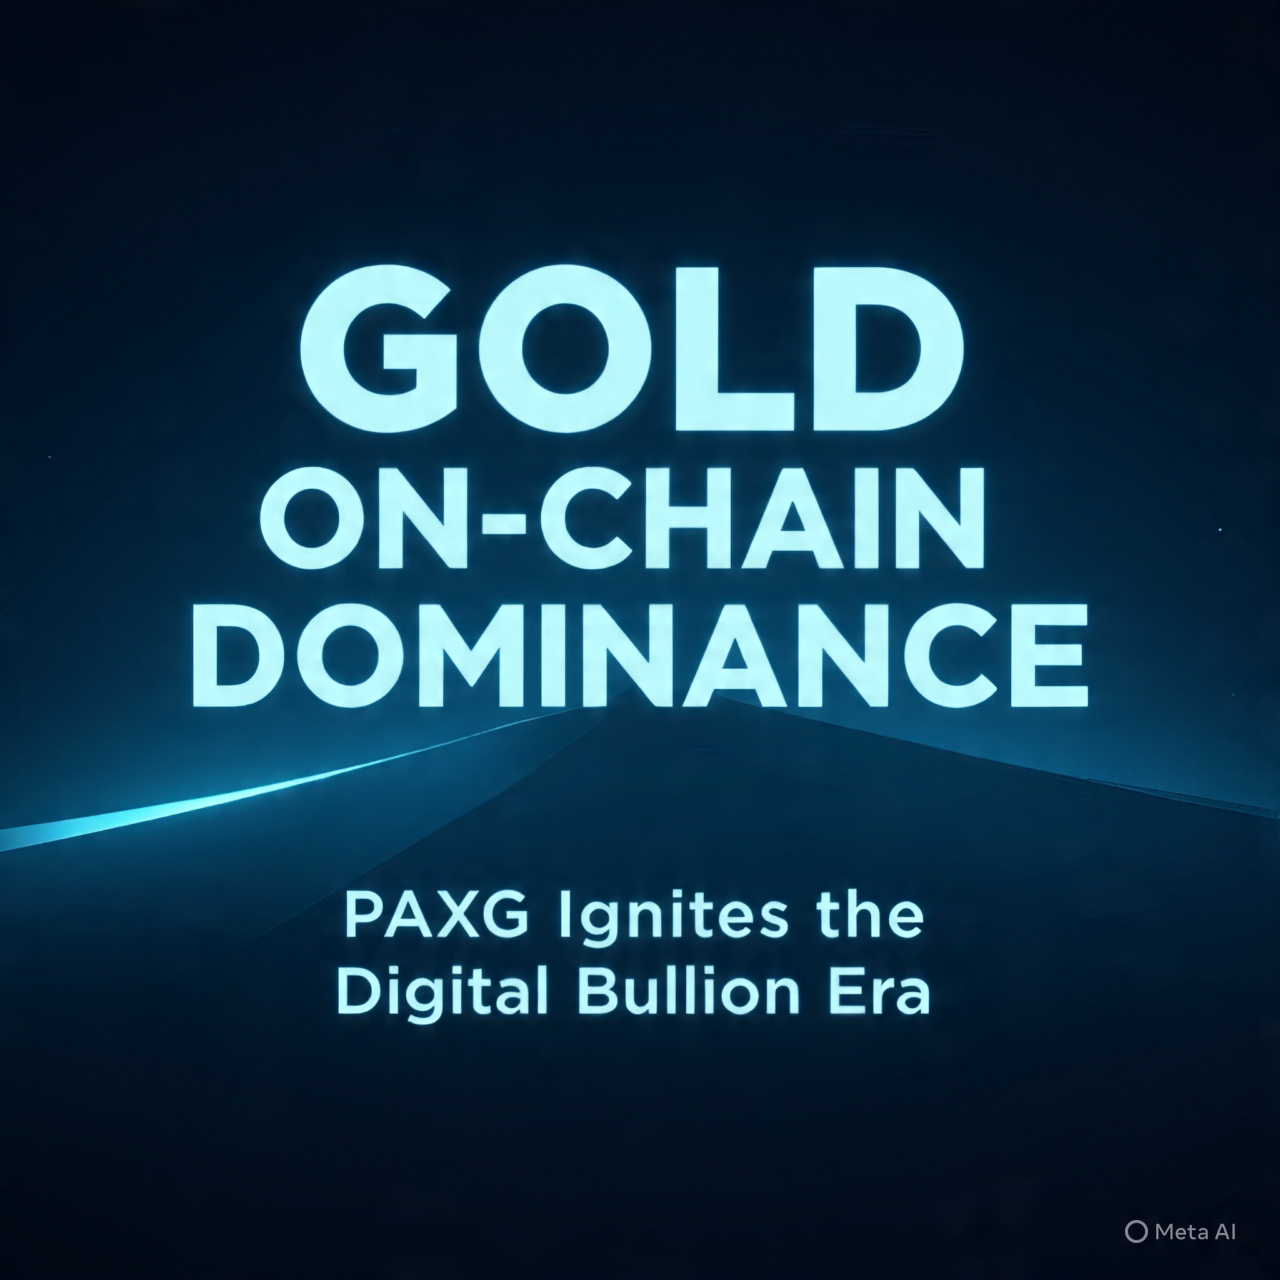
📊 Market Insight Update
Gold has been showing resilient structure amid macro pressure.
On-chain gold demand is rising as traders hedge against equity weakness.
$PAXG volume spikes suggest accumulation rather than short-term speculation.
Correlation with inflation narratives remains strong.
This isn’t just a “safe play” — it’s strategic capital rotation.
🎯 Trading Signal Outlook
Bias: Bullish Continuation
Zone to Watch: Previous consolidation breakout levels
Momentum: Gradual strength, low volatility expansion
Risk Profile: Lower beta compared to most crypto assets
If macro tension escalates, PAXG could see steady upside as capital seeks defensive exposure.
🔥 Why This Move Is Different
Unlike meme rallies or hype-driven pumps, gold-backed tokens thrive on:
Economic uncertainty
Central bank policy shifts
Geopolitical stress
Institutional hedging strategies
This makes $PAXG a stability anchor inside volatile crypto portfolios.
💡 Strategic Angle
Smart traders are not chasing noise — they’re building balanced exposure.
Gold-backed crypto like PAXG allows:
24/7 tradability
Fractional ownership
Cross-exchange liquidity
On-chain custody options
In a market where risk rotates quickly, digital gold is quietly reclaiming relevance.
 📌 Final Perspective
The question isn’t whether gold will remain relevant — it’s whether digital gold will outperform traditional access methods. With rising blockchain adoption, $PAXG stands positioned for long-term structural demand.
Here’s what the long-term structure shows:
2009 — $1,096
2010 — $1,420
2011 — $1,564
2012 — $1,675
Then came the silence.
2013 — $1,205
2014 — $1,184
2015 — $1,061
2016 — $1,152
2017 — $1,302
2018 — $1,282
📉 Nearly a decade of sideways action.
No hype. No headlines. No retail excitement.
That’s usually when serious accumulation happens.
Then momentum slowly returned:
2019 — $1,517
2020 — $1,898
2021 — $1,829
2022 — $1,823
🔍 Pressure was building quietly beneath the surface.
And then the expansion phase:
2023 — $2,062
2024 — $2,624
2025 —