Most traders see a "boring" chart and scroll past.
Smart traders see a coiled spring — and get ready to pounce.
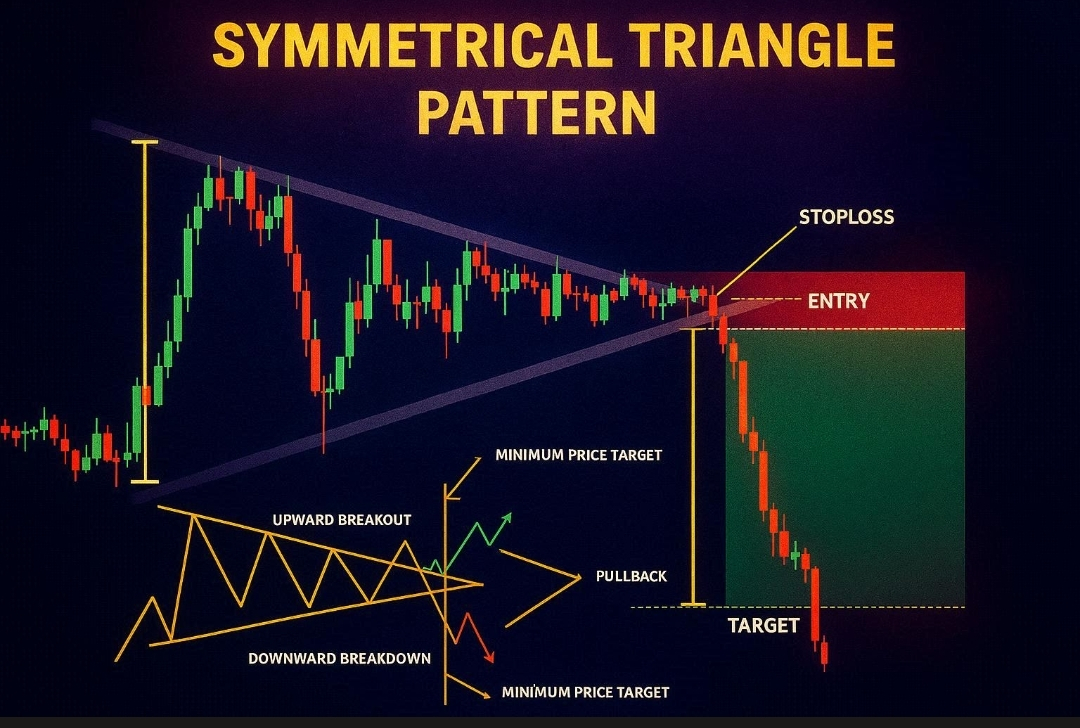
That pattern is called the Symmetrical Triangle — and it's one of the most powerful setups in all of technical analysis.
Here's everything you need to know 👇
---
🔺 What Is a Symmetrical Triangle?
It's what happens when the market can't make up its mind.
Price makes lower highs. Price makes higher lows. Both sides squeeze toward each other — forming a perfect triangle — until something breaks.
Two converging trendlines. Tightening volatility. Building pressure.
Think of it like squeezing a water balloon. The longer you squeeze... the harder it explodes.
---
👀 How To Spot It In 10 Seconds
✅ At least 2 lower highs connecting at the top
✅ At least 2 higher lows connecting at the bottom
✅ Both lines angling toward each other like a funnel
✅ Volume declining as the pattern forms
✅ Price approaching the apex (tip of the triangle)
The closer price gets to the apex — the bigger the incoming move.
---
⚡ Two Scenarios. Both Tradeable.
🟢 Scenario 1: Upward Breakout
Price bursts above the upper trendline with volume
➡️ Entry: On the breakout candle close — OR on the pullback retest of the broken trendline
➡️ Stop Loss: Just below the breakout level
➡️ Target: Measure the HEIGHT of the triangle — project it upward from breakout point
➡️ Result: Clean, high-probability long trade
---
🔴 Scenario 2: Downward Breakdown
Price crashes below the lower trendline
➡️ Entry: On breakdown candle close — OR pullback to the broken trendline
➡️ Stop Loss: Just above the breakdown level
➡️ Target: Same math — measure triangle height, project it downward
➡️ Result: Clean, high-probability short trade
---
💡 The Secret Most Traders Miss
The pattern is neutral — it doesn't predict direction.
Amateurs guess which way it'll break and enter early. They get chopped to pieces.
Professionals wait for confirmation. They let the market show its hand first — then strike with precision.
Patience is the edge. The setup does the rest.
---
📐 The Target Formula (Simple)
```
Measure the HEIGHT of the triangle at its widest point
↓
Add that distance to the BREAKOUT point (for longs)
↓
Subtract that distance from the BREAKDOWN point (for shorts)
↓
That's your MINIMUM price target ✅
```
No guessing. Pure geometry.
---
🎯 Pro Tips Before You Trade It
🔸 Volume confirmation is everything — a breakout on low volume is a fake-out trap
🔸 Wait for the pullback — the retest entry gives you a tighter stop and better R:R
🔸 Higher timeframe = more reliable — this pattern hits harder on 4H, Daily, Weekly
🔸 Context matters — a breakout in an uptrend is more powerful than one in a downtrend
🔸 Never anticipate — let price confirm, then enter with conviction
---
🧠 The Psychology Behind It
Why does this pattern work?
Bulls push price up. Bears push it down. Neither side wins. The range compresses. Traders on both sides get impatient — until finally one side overwhelms the other.
That moment of overwhelm = your trading opportunity.
You're not predicting the move. You're reacting to it with a plan already in place.
That's the difference between gambling and trading.
---
📋 Symmetrical Triangle Checklist
Before entering ANY trade on this pattern:
☐ Pattern is clear on the chart (2+ touches each side)
☐ Volume dropped during formation
☐ Breakout/breakdown confirmed on close
☐ Volume spiked on the breakout candle
☐ Entry identified (breakout OR pullback retest)
☐ Stop loss placed
☐ Target calculated using triangle height
☐ Risk/Reward is minimum 2:1
If you can't check every box — don't take the trade.
---
💬 Have you traded a Symmetrical Triangle before? Drop your experience below 👇
🔔 Follow for more pattern breakdowns, setups & market education — daily
#TechnicalAnalysis #cryptotrading #chartpatterns #priceaction #cryptoeducation