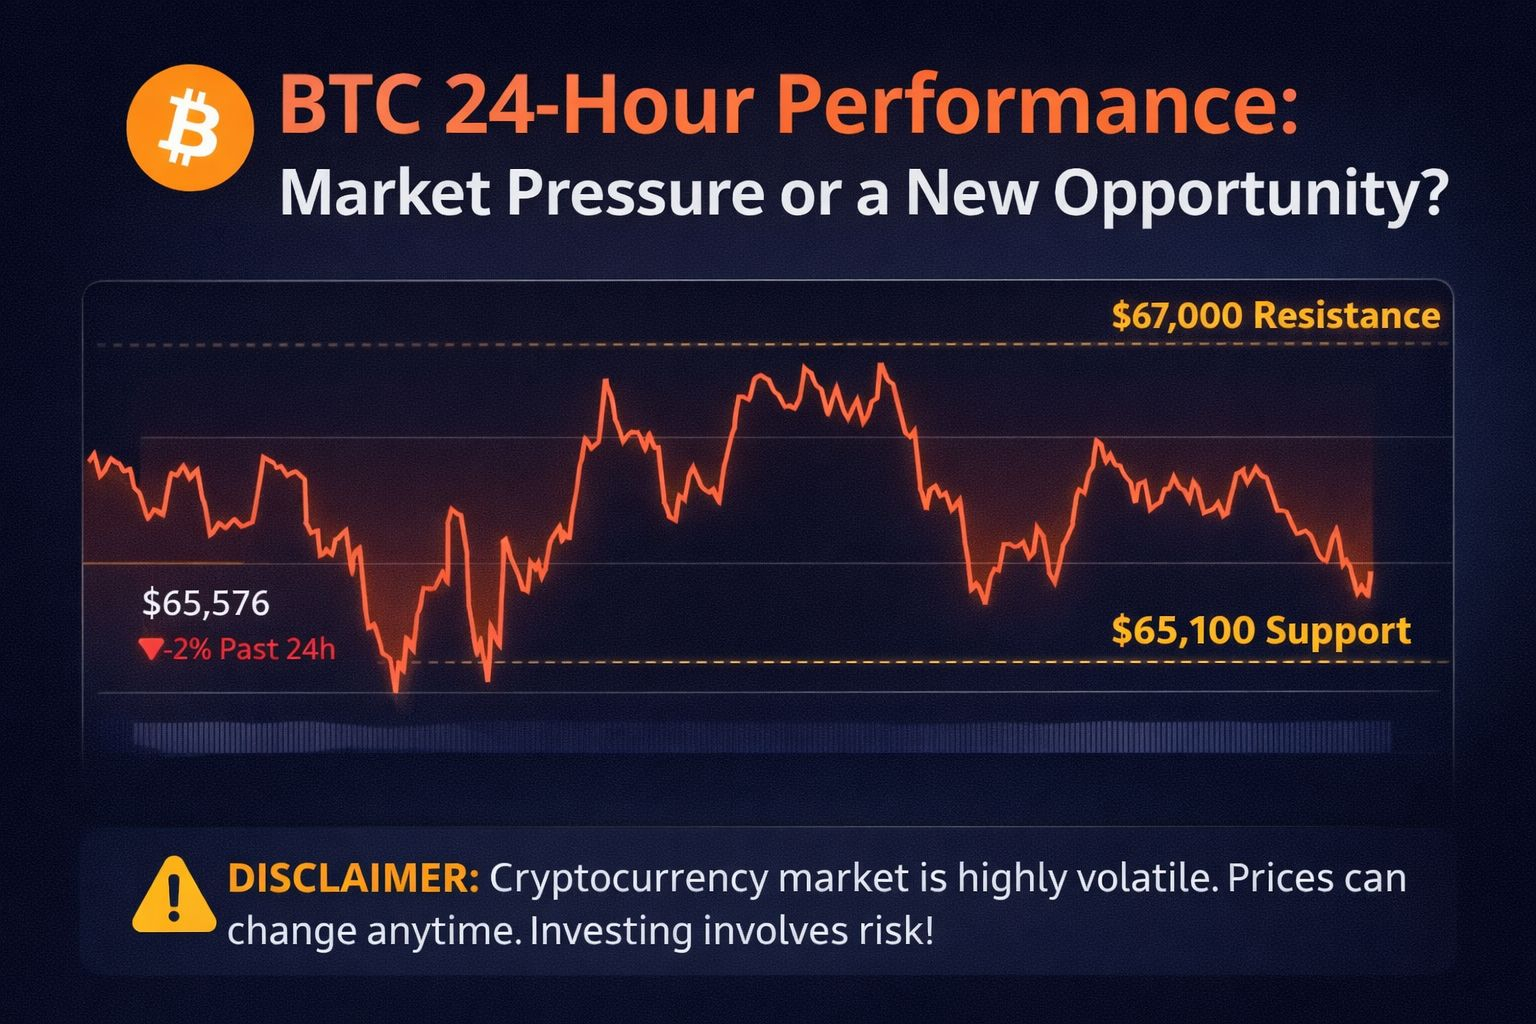
The last 24 hours in the crypto market have once again shown how dynamic and unpredictable Bitcoin can be. Currently, BTC is trading around $65,576, reflecting a decline of more than 2% over the past day. The chart suggests that price attempted to push higher but faced strong resistance and eventually moved downward under selling pressure.
What Is the Market Structure Indicating?
On the 24-hour chart, the $67,000 level appears to be a strong resistance zone. Each time the price approached this area, increased selling activity pushed it back down. On the downside, the $65,100–$65,300 range is acting as short-term support. If this support level breaks decisively, the price could move lower in the short term.
Overall, the trend during the 24-hour period has been mostly sideways, but recent price action shows growing bearish momentum. This may indicate short-term profit-taking by traders.
What Could Happen Next?
If buyers regain control and the price manages to sustain above the $66,500 level with strong volume, bullish momentum could return, potentially leading to another attempt at higher resistance levels. However, if the current support fails, further correction may follow.
Given the high volatility of the cryptocurrency market, even minor news or market sentiment shifts can trigger rapid price movements in either direction. Smart traders typically rely on proper risk management strategies, including stop-loss orders and controlled leverage.

⚠️ Disclaimer
This article is for informational and educational purposes only. The cryptocurrency market is highly volatile, and crypto prices can change at any time without warning. Always conduct your own research and consult a financial professional before making any investment decisions. Trading and investing involve risk, including the potential loss of capital.