💡 What’s Happening?
Ethereum ( $ETH ) is currently stabilizing after experiencing a sharp correction that pushed price down from the mid-$3,000 region toward the $1,900–$2,000 area. Following this strong decline, ETH is now consolidating just above the $2,000 level, suggesting the market may be attempting to establish a short-term base.
Despite this stabilization, the broader trend remains under pressure as price still trades below multiple key moving averages and previous support levels that have now turned into resistance.
🔹 Current Market Structure
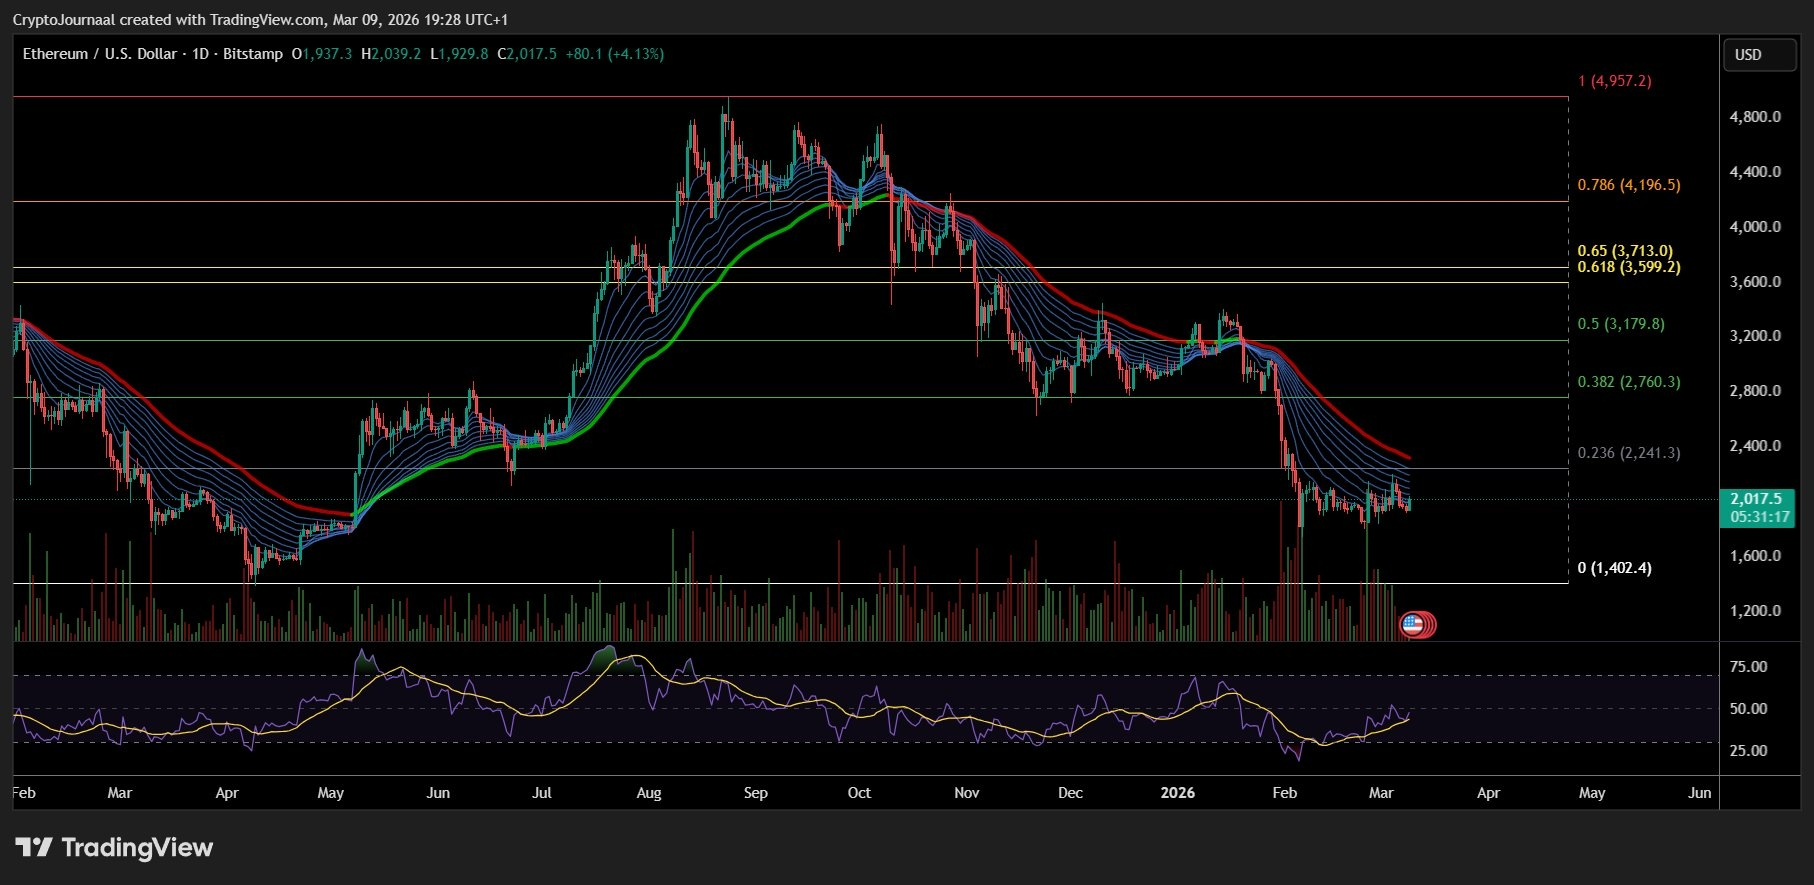
Over the past several months, ETH has transitioned from a strong bullish expansion phase into a clear downtrend characterized by lower highs and lower lows. The breakdown below the $2,760 (0.382 Fibonacci) level accelerated bearish momentum and triggered a rapid sell-off toward the $2,000 region.
Currently, ETH is consolidating between approximately $1,900 and $2,240 (0.236 Fibonacci). This range reflects short-term market indecision as buyers attempt to defend psychological support while sellers remain active on any upward moves.
The moving average ribbon remains downward sloping, indicating that bearish momentum still dominates the broader trend. For a meaningful recovery to develop, ETH would need to reclaim the $2,240 level and begin challenging higher resistance zones.
🔸 Key Technical Levels
Resistance:
$2,241 → $2,760 → $3,179 → $3,599
Support:
$1,900 → $1,600 → $1,402
RSI:
Currently recovering toward the 45–50 region after recently bouncing from oversold territory. This suggests selling pressure is cooling, though bullish momentum remains limited unless RSI breaks above 55–60.
📈 Scenario 1: Bullish
If ETH manages to reclaim the $2,241 resistance level and establish support above it, the market could initiate a relief rally toward higher Fibonacci levels.
A successful breakout would open the door for a move toward $2,760 and potentially the $3,179 region, where stronger resistance is likely to emerge.
🟢 Targets: $2,241 → $2,760 → $3,179
🟢 Invalidation: Daily close below $1,900
⚖️ Scenario 2: Neutral
If price continues to consolidate between $1,900 and $2,241, ETH would remain in a sideways accumulation phase following the recent sell-off.
Such consolidation could represent a cooling period where the market builds structure before deciding on the next directional move.
🟠 Range: $1,900–$2,241
🟠 Trigger: No decisive breakout or breakdown
🔻 Scenario 3: Bearish
If sellers regain control and push ETH below the $1,900 support zone, the market risks continuing the broader downtrend.
A breakdown could lead to a retest of $1,600 and potentially the major macro support near $1,402.
🔴 Targets: $1,900 → $1,600 → $1,402
🔴 Invalidation: Daily close above $2,241
💬 Summary
Ethereum is currently attempting to stabilize after a strong corrective move that erased a large portion of its previous rally.
While short-term consolidation suggests selling pressure may be slowing, the overall structure remains bearish as long as ETH trades below $2,241.
For bulls to regain control, reclaiming this level is essential. Until then, the market may continue ranging near $2,000 while traders watch for the next decisive breakout.