Introduction: A Macro View on BTC/USDT $BTC
This article breaks down the current macro structure of Bitcoin (BTC/USDT) using a powerful combination of Elliott Wave Theory and Smart Money Concepts (SMC) to define critical pivot points, high-probability targets, and risk zones.
Our analysis focuses on the Daily (D1) timeframe to identify the major swing structure that will dictate long-term strategy and high-conviction swing trades.
Section 1: The Elliott Wave Blueprint
The long-term BTC chart suggests we are deep into a massive bull cycle, having completed a robust 4-bullish wave structure. The primary expectation is the formation of the final impulse wave, Wave (5).
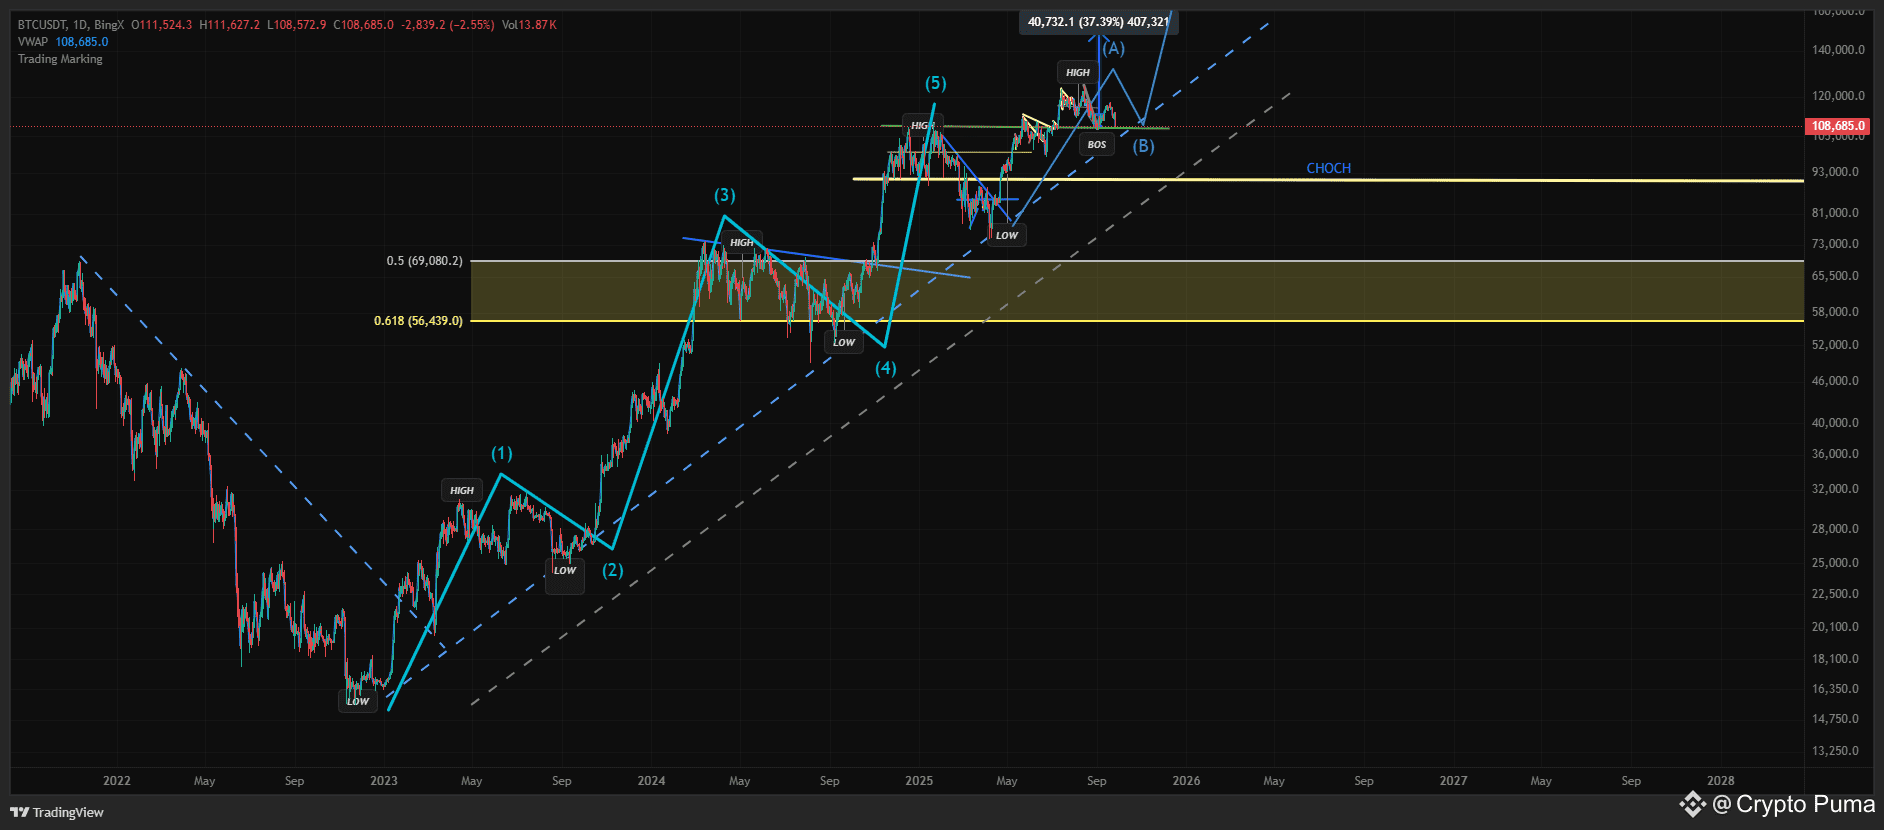
BTC/USDT 1D TIMEFRAME Waves (1) through (4): The structure on the chart clearly illustrates the initial four waves, with Wave (4) acting as a necessary correction preceding the final surge.
The Fifth Wave Target (Optimistic Scenario): Based on the typical Fibonacci relationships and extensions observed in previous waves (e.g., Wave 3 being 200% of Wave 1), the projected High-Probability Target Zone for Wave (5) ranges from 150,000 to 170,000 USD.
The Extreme Target: A highly euphoric scenario could push prices toward the 200,000−220,000 USD extended target.
Section 2: Defining Critical Market Structure (SMC)
The true power of this analysis lies in using SMC to validate the Wave (5) prediction and set clear invalidation points. The market is currently testing a crucial zone.
A. The Current Test: Previous Support
The price is currently re-testing a major support level, which was the peak of the previous upward impulse (the top of Wave 3). This level is critical for bullish continuation.
B. Bullish Continuation vs. Trend Shift
Two key SMC price levels define our immediate strategy:
Break of Structure (BOS) Invalidation (Approx. 107,000 USD):
In the context of a macro trend, the market requires successive Higher Highs (HH) and Higher Lows (HL) to maintain its structure.
A confirmed break below the swing low of the current BOS zone would signal a significant weakening of the bullish momentum and confirm a deeper correction (an A−B−C correction instead of a Wave 5 impulse). This would likely lead to a test of the Golden Zone.
Change of Character (CHOCH) (Approx. 90,000 USD):
This is the ultimate bearish pivot. The CHOCH level is defined by the swing low of the preceding major corrective wave (Wave 4 low).
A confirmed close below the CHOCH would unequivocally signal the start of a sustained downtrend or deep bear market phase, fully invalidating the immediate Wave 5 scenario.
Section 3: The Golden Zone and Deep Correction Risk
The 0.5 to 0.618 Fibonacci Retracement Zone (the Golden Zone) is the most crucial area for any potential deep correction or bear market bottom.
The Zone: Approximately 55,000 to 70,000 USD.
Significance: If the BOS level is lost, this is the highest-probability reversal area where a new major bull cycle (or a Wave C low) is expected to find strong buying interest. Traders should monitor lower timeframes for bullish CHOCH or accumulation patterns in this area.
Strategic Conclusion: Defining the Critical Pivot 🎯
The BTC/USDT market is currently at a critical inflection point. Professional traders must strictly monitor the price action around the structural Break of Structure (BOS) level (approx. 95,000 USD) on the Daily (D1) chart to determine the immediate path.
Key Scenarios for the Professional Trader
Bullish Impulse (Wave 5) Confirmation: A sustained D1 close above 125,000 USD confirms Wave (5) is underway, targeting the 150k−170k zone.
Deep Correction Risk: A confirmed D1 close below the BOS low (approx. 107,000 USD) signals a significant momentum shift. Traders should close long positions and prepare to scale into new longs near the Golden Zone (0.5−0.618 Fibo).
Bear Trend Confirmed: A confirmed D1 close below the CHOCH low (approx. 90,000 USD) represents the full invalidation of the bull thesis, requiring a shift to a macro short strategy.
Key Takeaway: The current bull market structure holds above 107,000 USD. Use the CHOCH at 90,000 USD as the ultimate line in the sand for the entire cycle.
Disclaimer: This is not financial advice. Trade with caution and always manage your risk.