$XRP is showing signs of consolidation in the short term, but the overall trend is still under pressure. The price continues to hover above key support zones, giving buyers a slight foothold, but resistance levels and descending trendlines are still limiting upside momentum.
Ripple Price Analysis: The USDT Pair
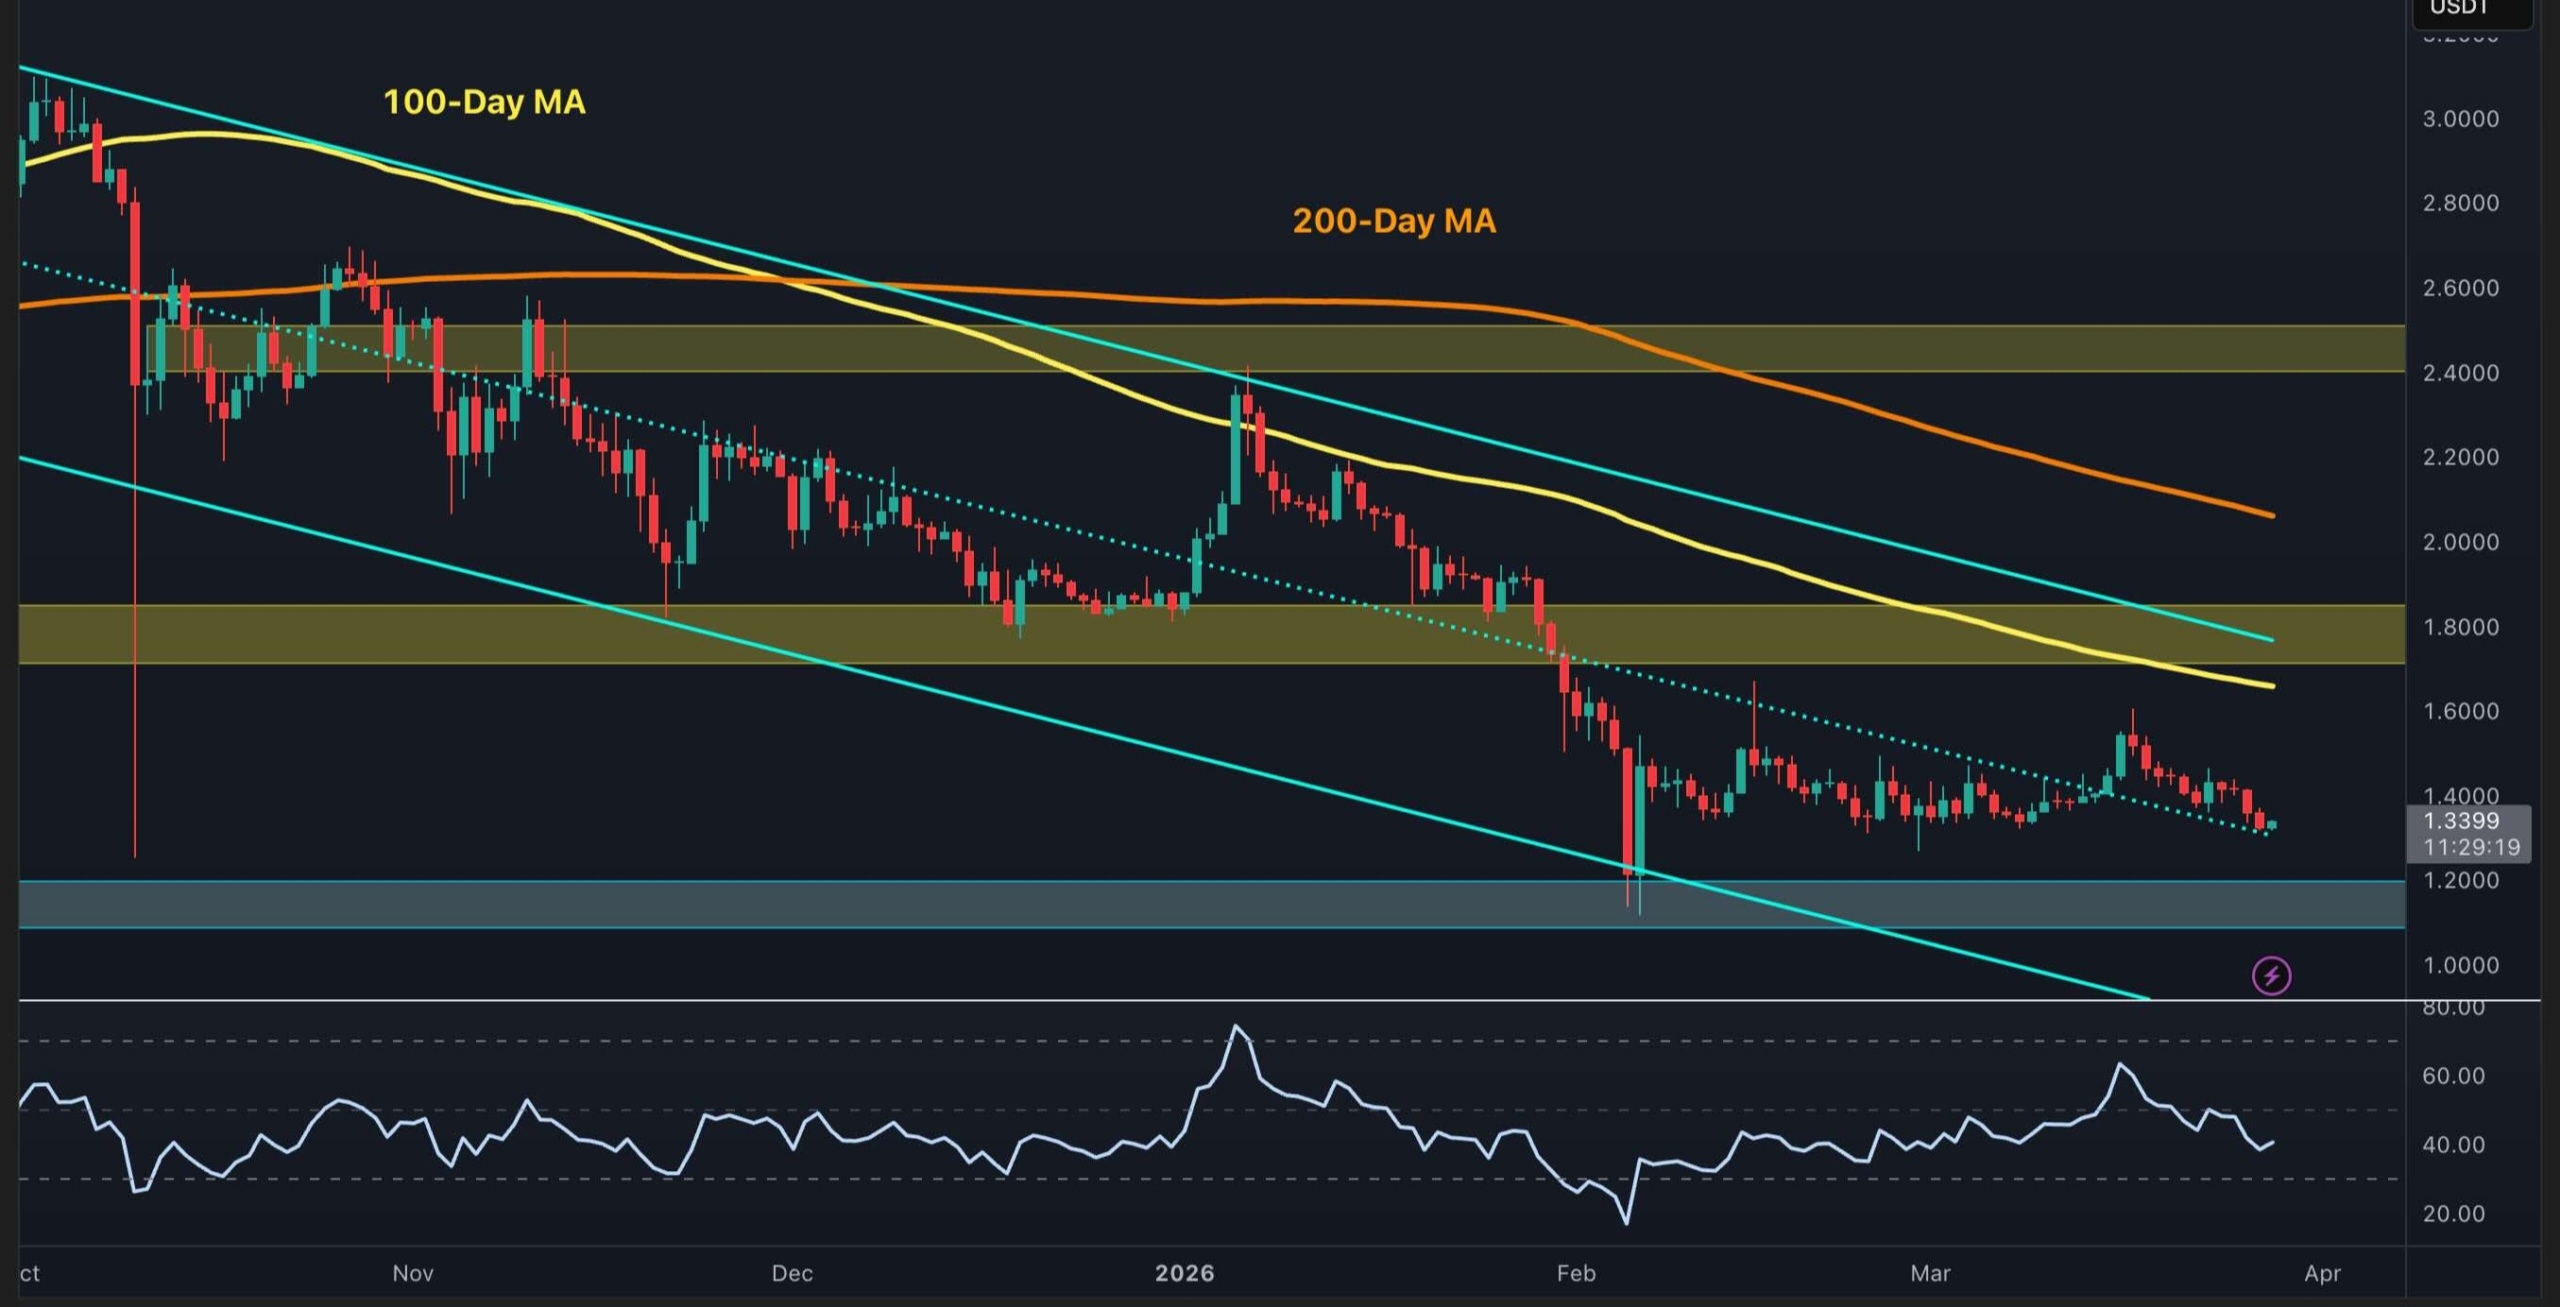
The asset is currently trading around $1.34 on the XRP/USDT chart. The price is just above the $1.20 support zone that has held recent lows. While there is a mild recovery attempt, XRP remains confined inside the descending channel and below both the 100-day and 200-day moving averages, located around the $1.80 and $2.10 levels, respectively. The overall structure remains bearish due to this. To shift the short-term sentiment more favorably, the asset would need to move above the $1.75 to $1.80 region for the buyers to regain control. However, the $1.20 support zone remains crucial because a fall below this level could trigger yet another liquidation cascade and significantly lower the price. The Pair of $BTC The cautious tone of the USDT counterpart can be seen in the XRP/BTC pair. $XRP is holding close to the key support area and the recent lows, hovering around 2,000 sats. Buyers must overcome the resistance clusters between 2,100 and 2,200 sats, which resulted from the convergence of the 100-day and 200-day moving averages, in order to generate a bullish outlook. However, a breakdown of the support level at 2,000 sats could be disastrous because it would likely result in a deeper fall toward the lower boundary of the descending channel at 1,600 sats or even below it toward the 1,500 sat horizontal support area. This scenario would have catastrophic effects because it would engender a very negative attitude that might take a long time to change.