
Markets enter the final stretch of Q1 under sustained pressure, with macro, geopolitical, and liquidity dynamics increasingly moving in the same direction. Bitcoin remains range-bound between $65,500 support and $72,000 resistance, still unable to reclaim the $80,000 level that defined last year’s structure, while equities continue to weaken with five consecutive weekly losses and rising recession probabilities. At the same time, escalating geopolitical tensions are feeding directly into commodities, pushing Brent crude toward $115 and reinforcing inflationary pressures just as markets were leaning toward policy easing.
Price action in Bitcoin reflects this growing fragility. The move down to $65,000, within range of the $64,000 low from Feb. 28 when the conflict began, marks a key technical inflection. Over the past five weeks, Bitcoin had been forming a constructive pattern of higher lows across each escalation, progressing from $64,000 to $66,000 to $68,000 to $69,400 to $70,596. The break below $66,000 on Monday is the first deviation from that structure, signaling a potential shift in momentum and raising the risk of a breakdown from the war-time range if the trend is not quickly reclaimed.
Simultaneously, the macro backdrop is becoming more complex. The latest escalation, including Houthi involvement, new U.S. troop deployments, and Iranian strikes on aluminum facilities, is broadening the inflation shock beyond energy into industrial supply chains. With oil elevated and metals spiking, inflation risks are re-accelerating at a time when central banks were expected to pivot. This places the Federal Reserve in a tighter position, potentially delaying rate cuts further and reinforcing a more volatile, macro-driven environment for risk assets.
In this issue, I’ll break down what actually drove the movement, how macro catalysts are compressing into a high-impact window, what on-chain flows are revealing about holder behaviour, and where structural momentum may emerge next.
Let’s get into it.
Note to Readers:
Over the past months, many readers have told us that the Crypto Market Weekly has become a core part of their routine, and we will continue publishing these weekly updates here on Substack as usual.
As we evolve our research offerings, our long-form institutional research will gradually move from Substack to a dedicated research hub on our community platform. As part of this transition, paid Substack subscriptions for long-form reports will be discontinued going forward. Existing subscriptions will be cancelled as we shift to this new model, while the weekly market updates will remain available here unchanged.
We are building a more focused research environment designed for deeper, curated, institutional-grade analysis for investors. More details on the transition to new research hub and access model will be shared soon.
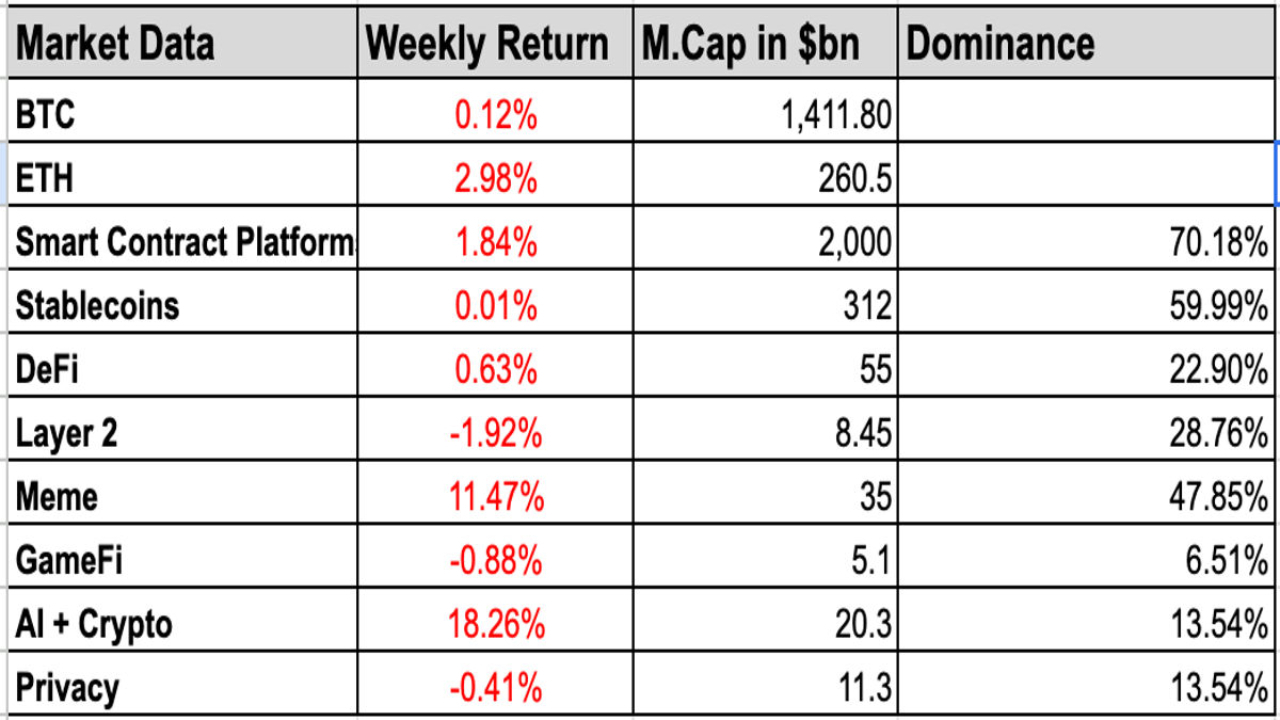
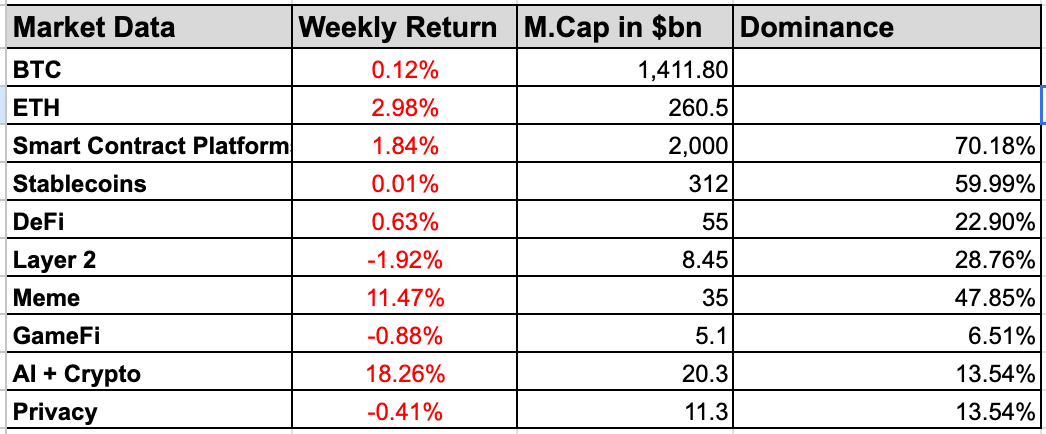
1. Sector Performance & Key Developments
Trump-backed American Bitcoin hits 7,000 BTC as holdings expand rapidly
Trump crypto czar David Sacks exits role after 130 days
Ethereum Foundation Breaks Its Own Record With a $46.2 Million ETH Staking
Canada Proposes Ban on Crypto Donations to Prevent Foreign Election Interference
SBF Pardon Odds Drop After Parents’ Interview
UK Bans All Cryptocurrency Donations to Political Parties
Step Finance to shutter following devastating $27M hack
Binance stablecoin reserves have sunk 19% since November
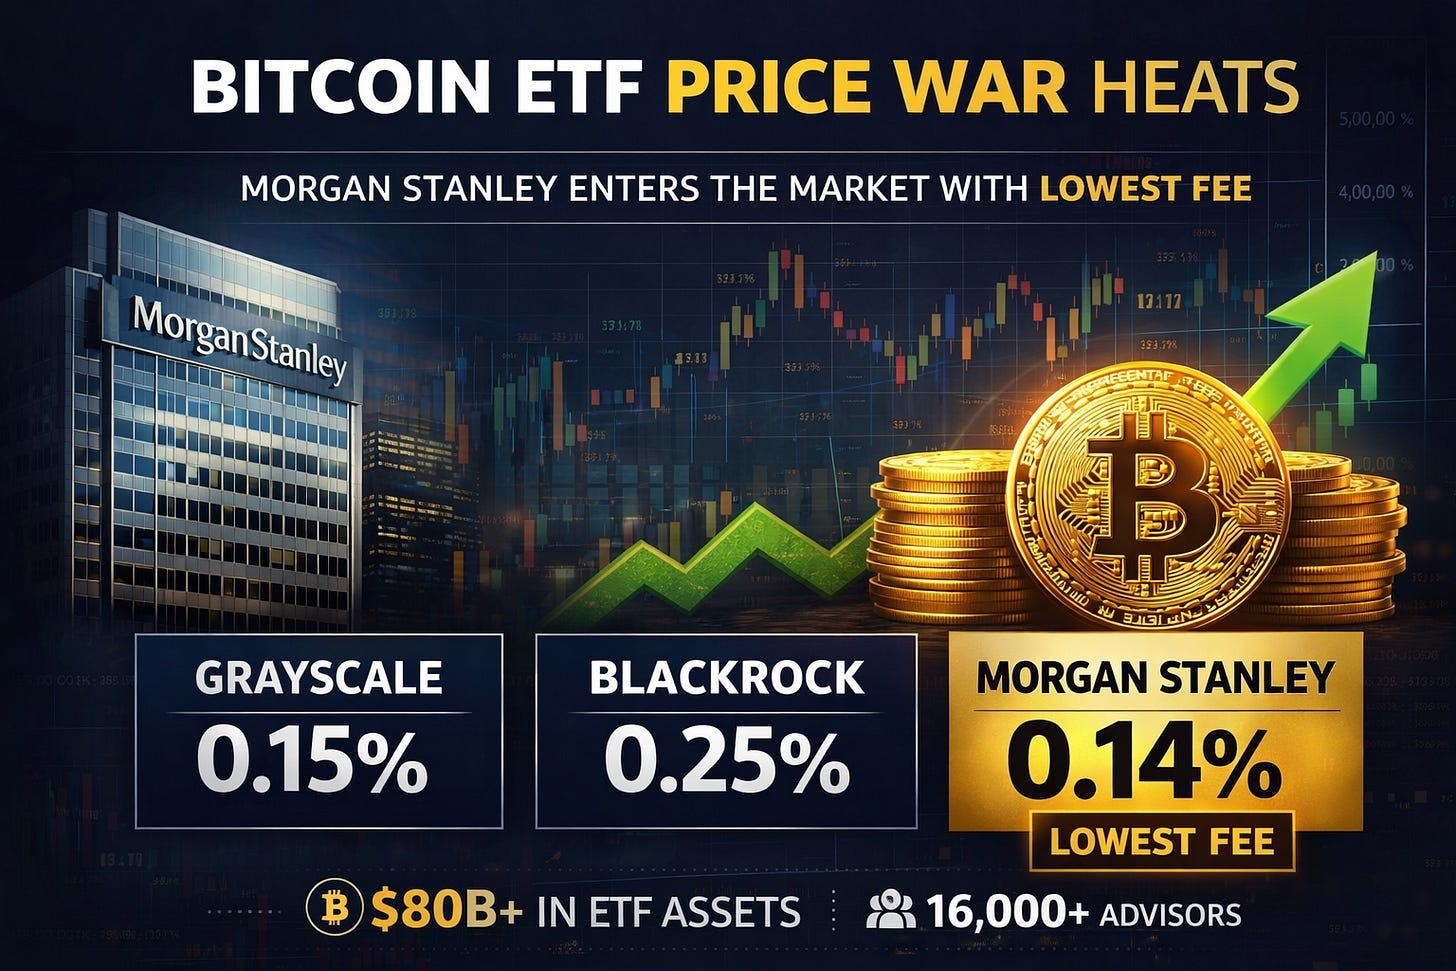
2. The Bitcoin ETF Price War Begins
The Shift: From Flows to Fees
For most of the past year, the Bitcoin ETF narrative was simple: track the flows, follow the leaderboard, identify the winners. That framework no longer holds. The axis of competition has shifted, and price is now the variable that matters.
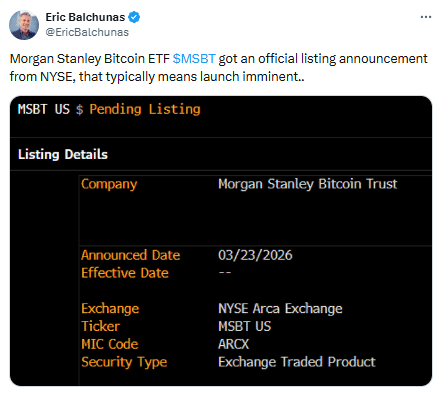
Morgan Stanley entering the market at 14 bps with MSBT is not just another launch, it is a reset of the competitive baseline. It undercuts BlackRock’s IBIT at 25 bps and even edges past Grayscale Investments’s 15 bps Mini Trust. In traditional finance, once fee compression starts, it rarely reverses. The lowest price quickly becomes the reference point.
This is the moment Bitcoin ETFs stop being a distribution race and start becoming a margin game.
Why This Actually Matters
At ~$80B+ in size, the Bitcoin ETF market has so far been driven by access. Whoever could get in front of the most capital won. Morgan Stanley changes that equation by combining two levers that rarely come together at the same time: lowest cost and strongest distribution.
The firm controls one of the largest advisor networks globally. Layer a 14 bps product on top of that, and the pitch becomes almost trivial: same Bitcoin exposure, lower fee, delivered through a trusted channel. Historically, that combination doesn’t compete, it captures.
The second-order effect is more important. Fee compression doesn’t just shift flows, it expands the market itself. Lower cost reduces friction, which increases allocation comfort, particularly for advisors operating under cost scrutiny.
The Scale Question
The numbers being discussed sound aggressive, but they point in the right direction. Even a low single-digit allocation from Morgan Stanley’s client base would translate into flows that rival or exceed the current ETF market size.
That’s the key shift. This is no longer about taking share from existing players. It’s about expanding the pie while simultaneously reshuffling it.
Lower fees → larger addressable allocation → accelerated inflows → leaderboard disruption.
Not a First Move, a Calculated One
What stands out is that Morgan Stanley isn’t entering reactively. It has already had exposure to the ETF ecosystem, allocating through products like IBIT and observing flow dynamics up close.
This is a second move, not a first attempt.
Internally, the framing goes beyond ETFs. The push ties into a broader thesis around financial infrastructure modernization, spanning tokenized assets, digital securities, and backend settlement layers. The ETF is the distribution wrapper. The strategy is deeper.
What Comes Next
MSBT is cleared for listing on the NYSE, with trading expected to follow. From there, the pressure propagates across the ecosystem.
Key questions now define the next phase:
Do flows start responding directly to fee differentials?
Do incumbents cut pricing to defend share?
Does this evolve into a full-scale race to the bottom?
Because precedent here is clear. From index funds to brokerage commissions, once price becomes the primary lever, competition compresses margins until only scale matters.
That transition has now begun in Bitcoin ETFs.
3. Macro Backdrop
1. Consumer Sentiment Isn’t Noise
There’s a tendency to dismiss consumer surveys as unreliable, but that misses how economies actually function, they run as much on expectations as on hard data. If there were a better real-time proxy for public mood, markets would use it, but there isn’t. Consumption, wage demands, and pricing behavior are all shaped by what people believe is coming next. This is exactly why the Federal Reserve places so much weight on expectations through forward guidance, not just to guide markets but to influence public perception. When Powell talks about inflation expectations, he is referring to household beliefs, not market-implied breakevens. The key risk the Fed worries about is expectations becoming “unanchored,” meaning persistently elevated, which weakens policy effectiveness as behavior adapts. The latest University of Michigan survey suggests early signs of this pressure building:
One-year inflation expectations jumped to 3.8% from 3.4%, the sharpest rise since April 2025, signaling rising near-term inflation anxiety
Longer-term expectations (5–10 years) eased slightly from 3.3% to 3.2%, indicating that credibility is holding, but only marginally
Around two-thirds of responses came after the Iran conflict escalation, likely feeding into inflation fears via energy and supply shocks
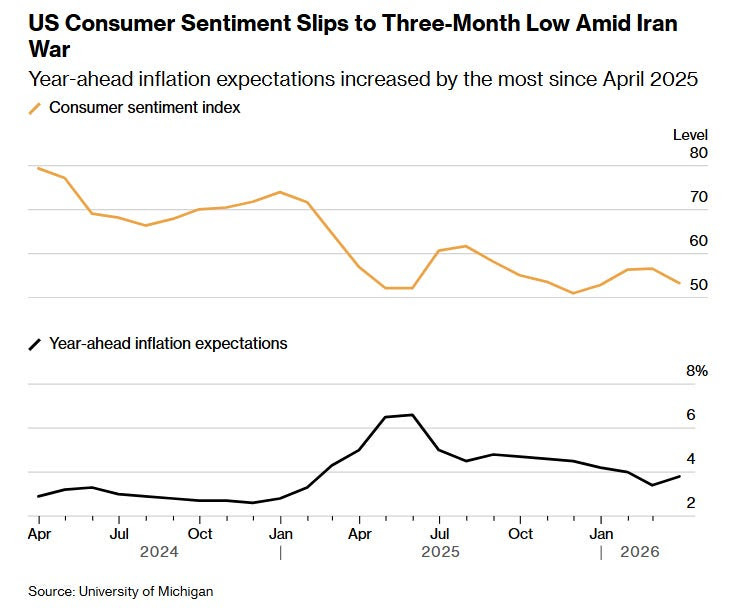
This creates a difficult policy setup, rising short-term expectations alongside commodity-driven inflation pressures reduce the Fed’s flexibility. Cutting too early risks reinforcing inflation psychology, while staying tight risks over-tightening into a slowing economy. Consumer sentiment may be imperfect, but it is often the first place where macro stress surfaces, and right now, it is moving in the wrong direction.
2. Pressure On Equities
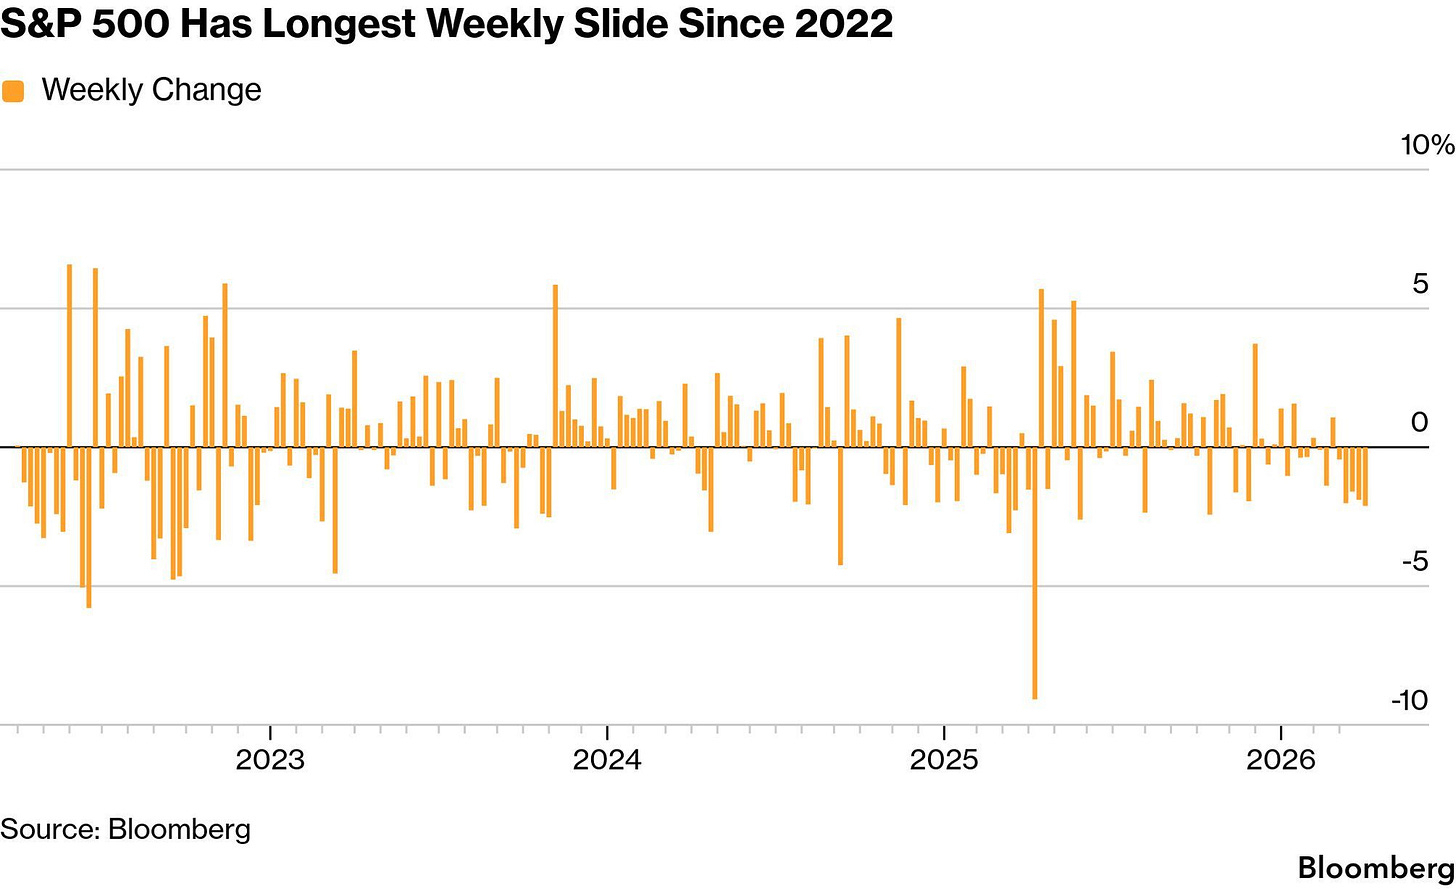
That same macro pressure is now showing up clearly in equities, and the signal is getting harder to ignore. The S&P 500 has just recorded its fifth consecutive weekly decline, the longest losing streak since 2022, reflecting a steady deterioration in risk appetite rather than a one-off correction. This drawdown is being driven by a combination of rising energy prices and increasing recession risk, with Moody’s now placing recession probabilities close to 50%, levels that markets cannot easily dismiss. The key developments driving this move:
Five straight weeks of losses, a rare occurrence that typically signals deeper macro stress rather than short-term volatility
Oil pushing higher, feeding directly into inflation expectations and compressing margins across sectors
Recession probabilities rising sharply, shifting positioning toward defense and away from growth
At this point, equities are no longer trading on earnings optimism or soft-landing narratives, they are reacting to macro constraints. The path forward is relatively binary: either geopolitical tensions ease and energy prices stabilize, allowing risk sentiment to recover, or elevated oil sustains inflation pressure and pushes markets further into risk-off territory.
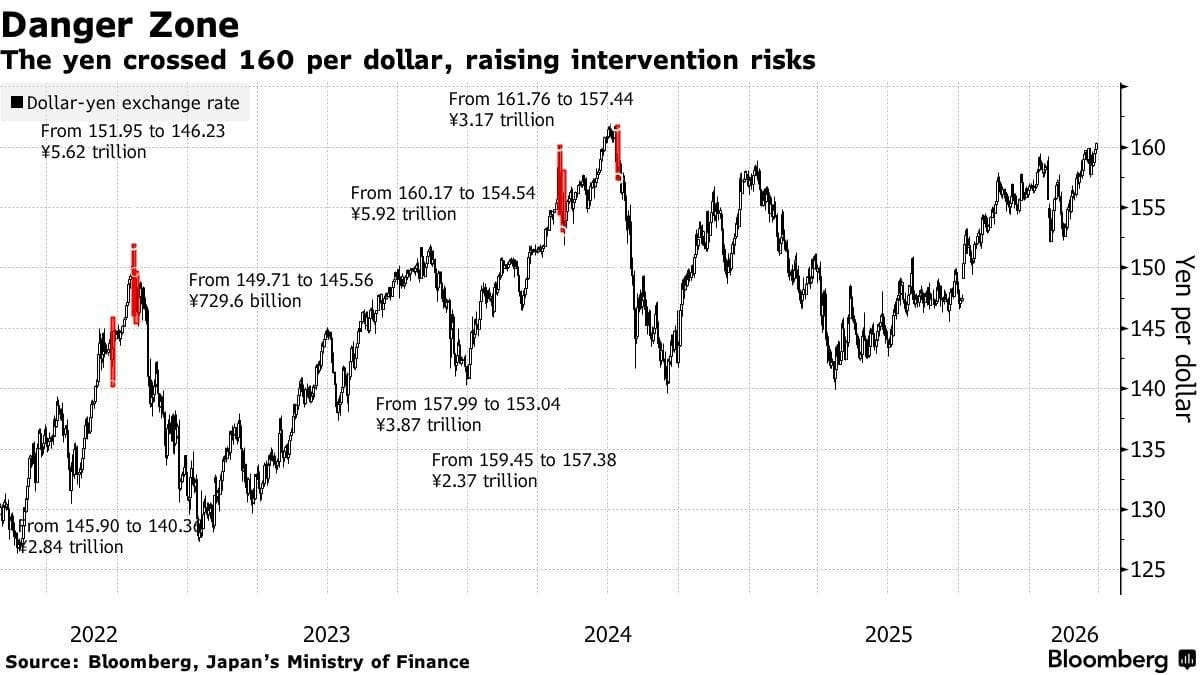
3. Bond Market Watch
A parallel pressure point is building in Japan, and markets are starting to pay attention. The yen has weakened past 160 per dollar, the same level that triggered aggressive, multi-trillion-yen intervention in 2024, and officials are already stepping up verbal warnings. This isn’t just a currency story, it’s a positioning risk. A sharp reversal in the yen, especially if driven by intervention, has the potential to unwind carry trades rapidly, forcing capital out of risk assets globally. The key dynamics to track:
Yen breaching 160, historically a trigger point for policy action
Rising probability of intervention from Japanese authorities
Risk of carry trade unwind, which could transmit volatility across equities, bonds, and crypto simultaneously
At the same time, U.S. Treasury yields are reflecting a more complex macro tension. The 10-year yield moved higher through most of March on inflation concerns, only to reverse sharply toward month-end as recession fears took hold. This push and pull highlights the core problem markets are facing:
Inflation pressures, driven by energy and supply shocks, pushing yields higher
Growth concerns, pulling yields lower as recession risks rise
Bond markets effectively pricing two conflicting narratives at once
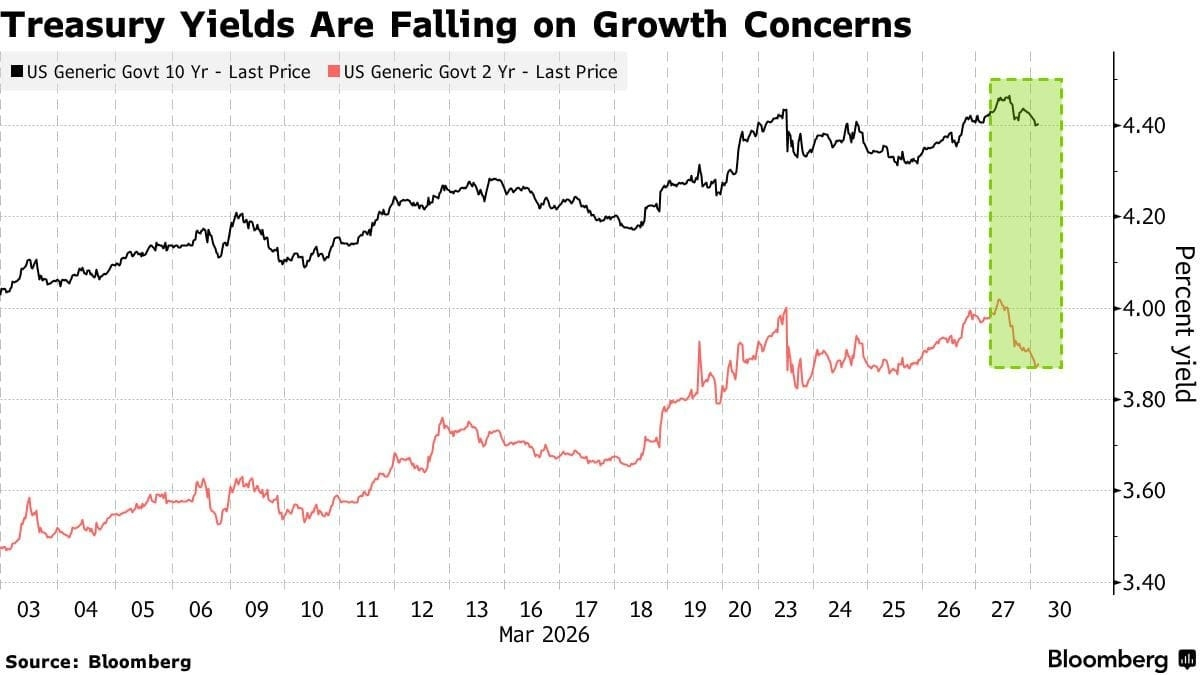
This is the essence of a stagflationary setup, rising prices alongside slowing growth, and it is one of the most difficult environments for markets to price. Directional conviction breaks down, volatility rises, and cross-asset correlations become unstable.
4. ETF / ETP Flow Insights
Momentum Break After Four-Week Run
Bitcoin ETFs saw $296M in net outflows, marking the first weekly reversal after a strong multi-week inflow streak. The shift signals that flows are no longer trend-following by default and are now reacting more directly to macro and price weakness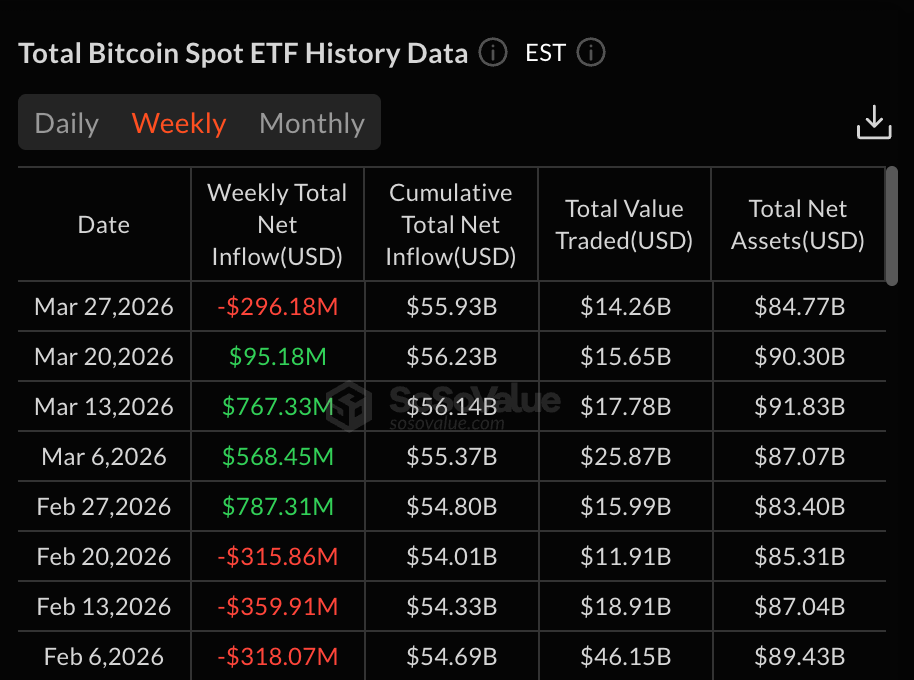
IBIT Drives the Downside
BlackRock’s IBIT, typically the anchor of inflows, became the largest source of outflows, including a $201M single-day withdrawal. When the strongest product starts leading redemptions, it reflects institutional de-risking rather than retail rotation.Ethereum ETFs Show Structural Weakness, With One Exception
Ether ETFs recorded $206M in outflows, extending a persistent multi-day decline. The only standout was BlackRock’s ETHB, which pulled in ~$141M, likely driven by its staking feature, pointing toward yield-bearing exposure as the next competitive edge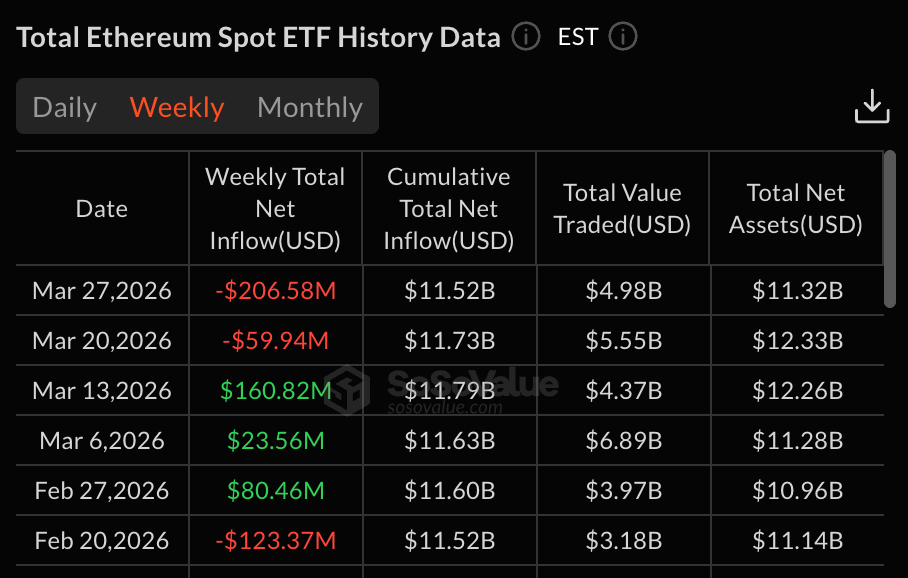
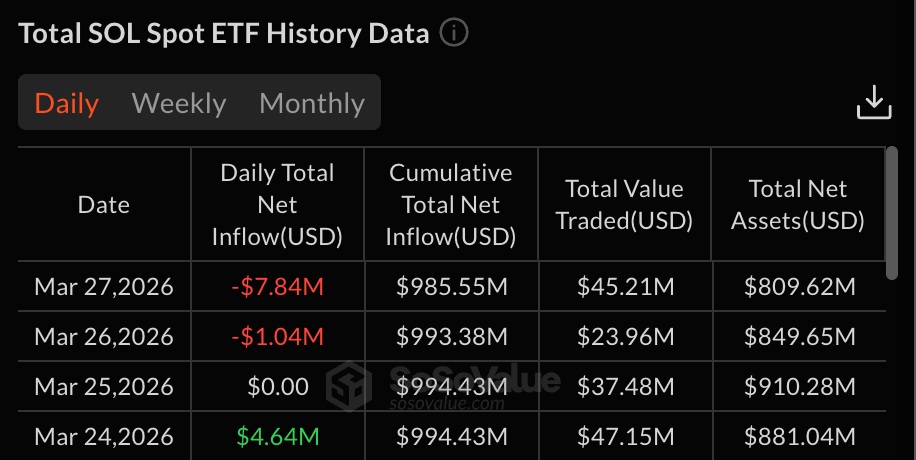
Clear Rotation Beneath the Surface
While BTC and ETH saw broad outflows, smaller segments showed divergence: Solana ETFs recorded mild outflows (~$4.2M), while XRP ETFs saw modest inflows (~$2.66M). This suggests capital is not exiting the space entirely but is becoming more selective, rotating toward differentiated narratives rather than broad beta exposure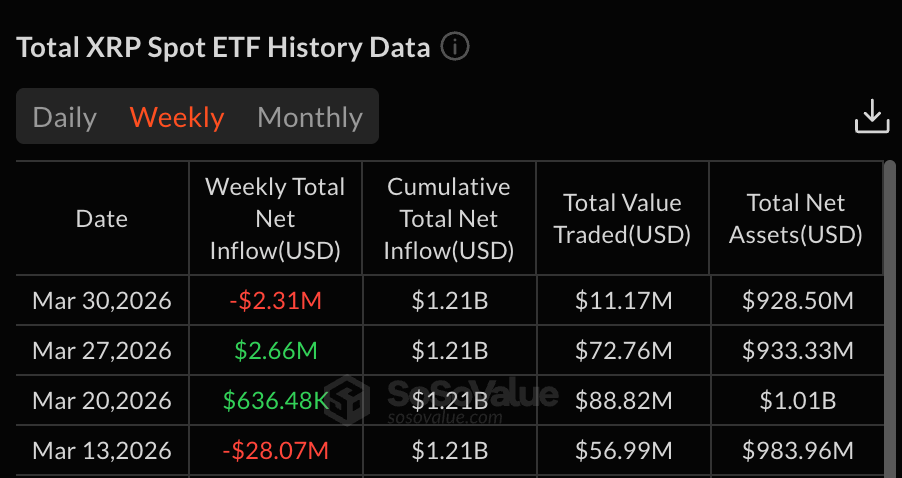
5. The Week Ahead
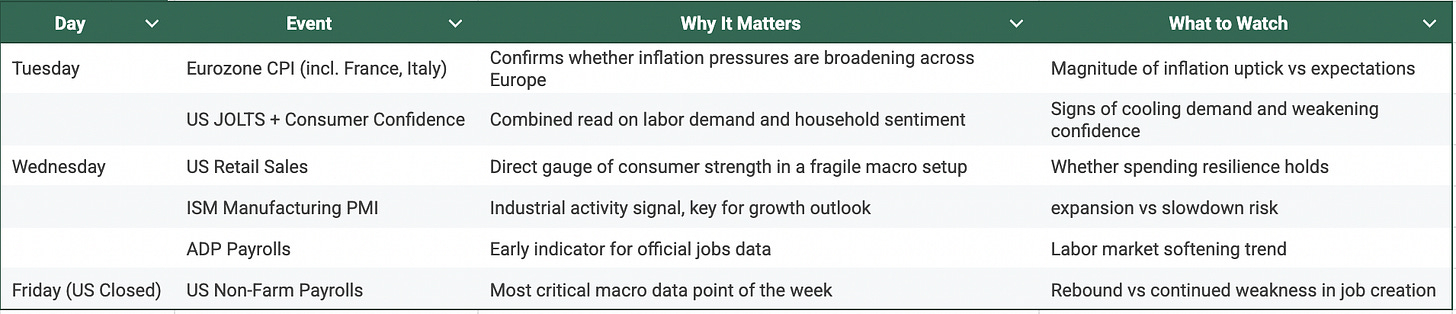
Focus: Inflation prints post geopolitical escalation + labor market resilience. These will directly shape rate expectations and risk asset direction.
6. Conclusion
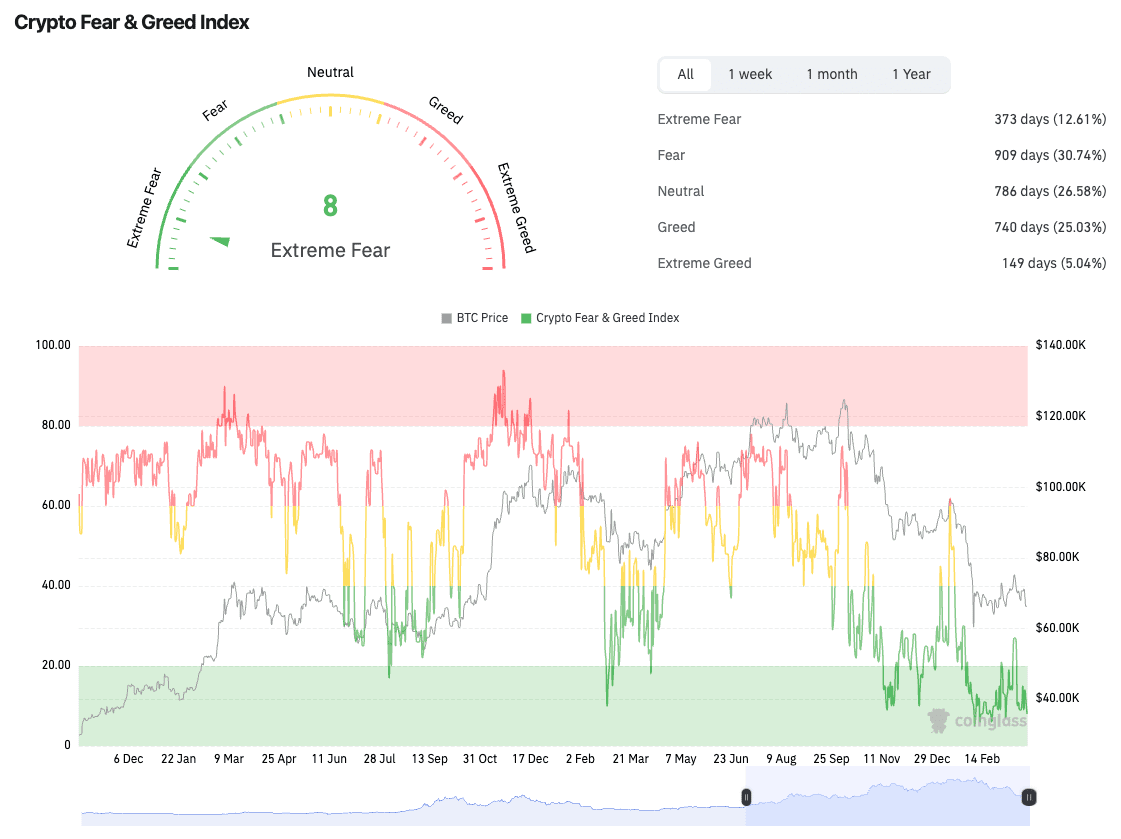
Sentiment has shown no real signs of recovery. The Fear & Greed Index remains anchored at 8, effectively unchanged from the deeply pessimistic levels that have persisted since January. Over this entire period, there has been just one brief attempt to move out of extreme fear into normal fear territory, and even that failed to sustain.
Index stuck at extreme lows, with no meaningful rebound in sentiment
Only one failed attempt to break out of extreme fear since January
Persistence, not just depth, is the key signal here
Markets can typically absorb short bursts of panic. What stands out now is the duration of this suppression. This is no longer episodic fear, it reflects a more structural shift in positioning, where participants remain cautious, underexposed, and unconvinced by short-term recoveries.
In a market driven by liquidity swings and institutional flow, our Crush Circle platform by CryptoCrush gives investors direct access to expert research, real-time guidance, and the frameworks needed to stay ahead of the next big move.
This article is for information and education only and is not investment advice. Crypto assets are volatile and high risk. Do your own research.
📌 Follow @Bluechip for unfiltered crypto intelligence, feel free to bookmark & share.