
Key Highlights
LayerZero falls nearly 9% in 24 hours, extending its short-term downtrend after failing to hold above $2.00.
A $15M+ transfer by Alameda Research to Wintermute adds fresh supply pressure, triggering a swift price decline.
Loss of the 50-day moving average signals weakening momentum, with price now testing critical support near $1.75.
If support breaks, the bearish structure could push ZRO toward the $0.90 level, marking a potential major downside move.
LayerZero is under notable selling pressure as of March 31, 2026, with the token trading near $1.83, down 8.95% over the past 24 hours. After briefly climbing to a daily high of $2.04, the price reversed sharply, bringing its market capitalization down to approximately $574 million.
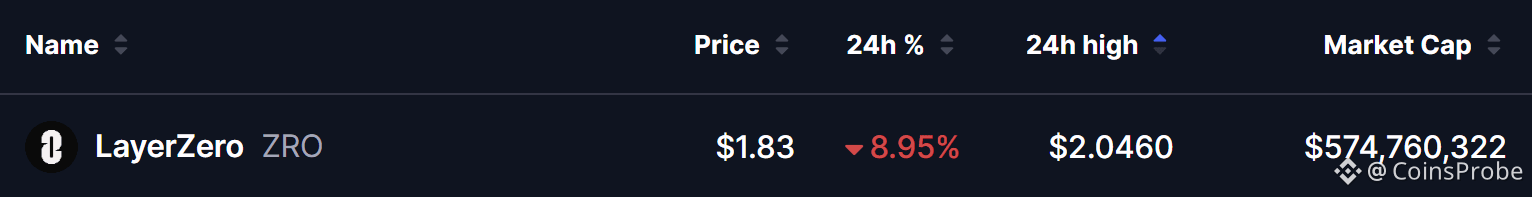 LayerZero (ZRO) Price/Source: Coinmarketcap
This marks another session of weakness for the omnichain interoperability token, which continues to lag amid broader market consolidation. The latest decline appears closely tied to a major on-chain transfer, once again highlighting the impact of large-holder activity on price action.
Alameda Transfer Sparks Selling Pressure
The immediate catalyst behind the drop stems from activity linked to the FTX/Alameda estate.
According to Lookonchain, Alameda Research transferred 7.93 million ZRO (worth roughly $15.3 million) to Wintermute. Shortly after the transaction, the token saw a ~6% decline from local highs.
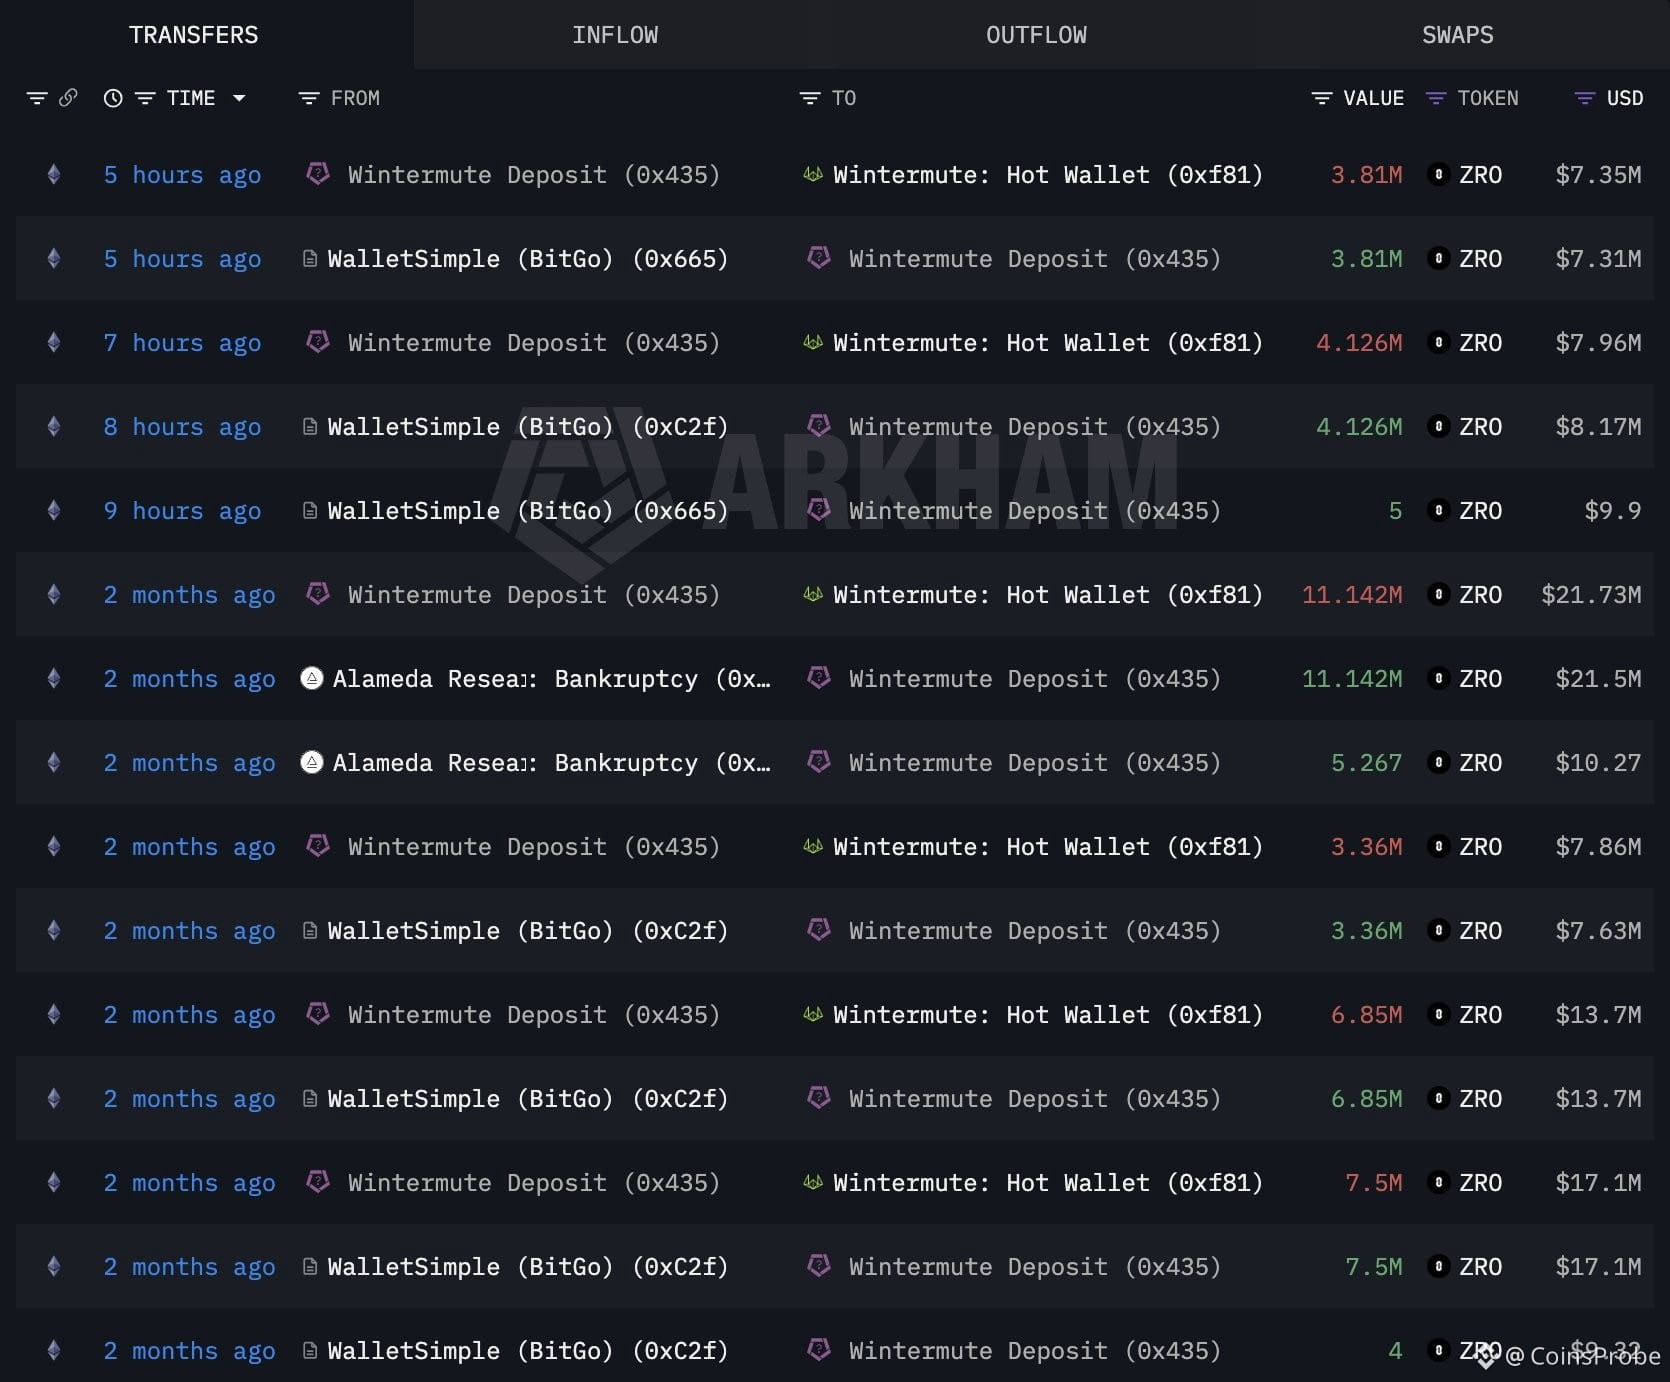 Alameda Deposits $ZRO to Wintermute/Source: @lookonchain (X)
This isn’t the first time such a move has occurred. Alameda-linked wallets have repeatedly transferred tokens near peak levels, often signaling distribution phases. These events typically introduce fresh supply into the market, which market makers absorb and redistribute—adding short-term downside pressure.
Technical Structure Turns Bearish
From a technical perspective, ZRO is showing signs of weakness, forming a right-angled descending broadening wedge—a pattern often associated with bearish continuation unless invalidated.
Key levels to watch:
Resistance (Neckline): $2.29 – $2.44
50-Day Moving Average: $1.89 (recently lost)
100-Day Moving Average: $1.75 (currently acting as key support)
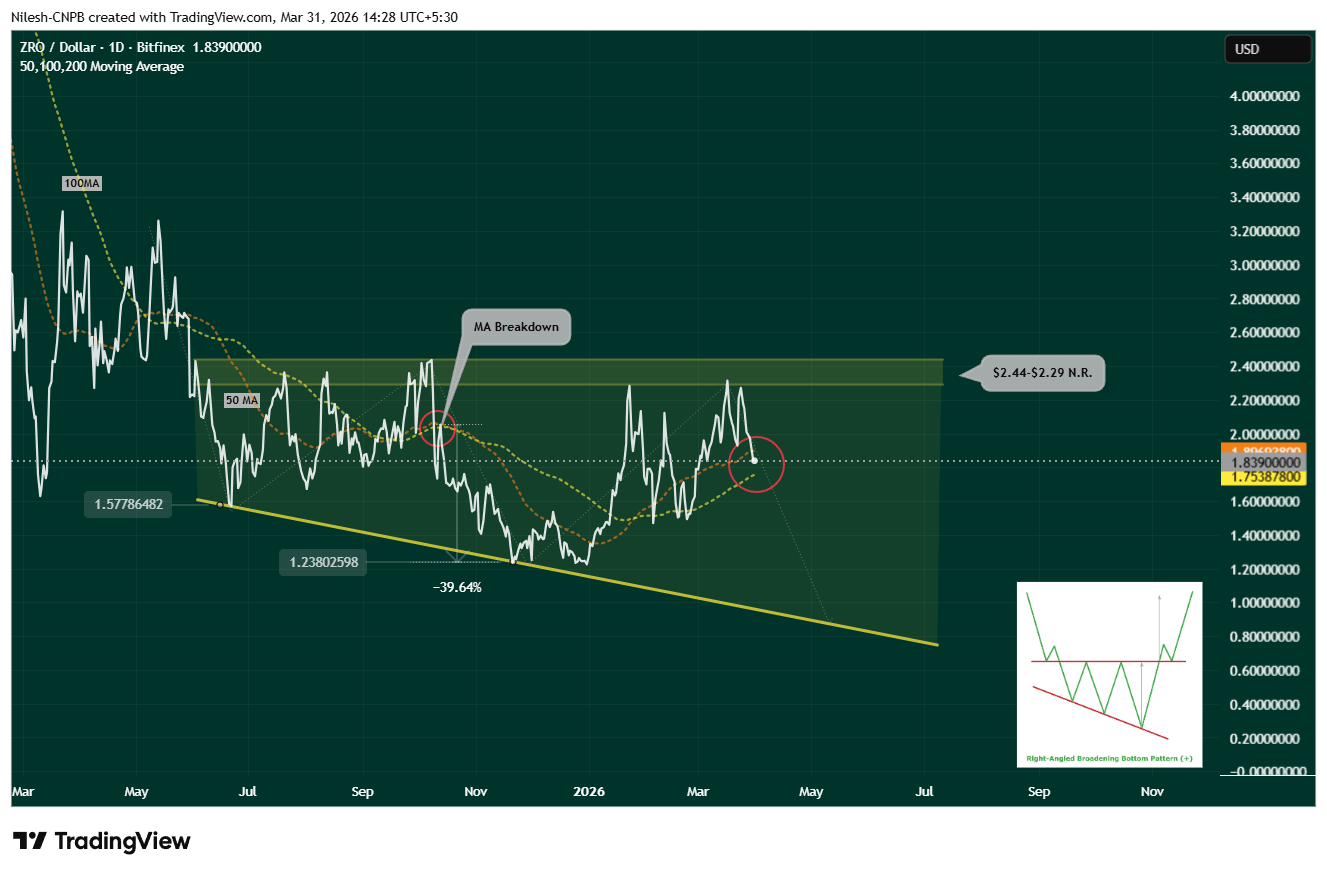 LayerZero (ZRO) Daily Chart/Coinsprobe (Source: Tradingview)
The breakdown below the 50-day moving average indicates fading bullish momentum. Price is now hovering just above the 100-day MA, a critical support level that could determine the next move. Notably, a similar breakdown in the past resulted in a nearly 40% correction, reinforcing downside risks if support fails.
What’s Next for ZRO?
Bearish scenario:If ZRO fails to hold the 100 day ma near $1.75 support, the current pattern suggests a potential decline toward the $0.90 level—a major psychological and technical zone that could mark new 2026 lows.
Bullish scenario:A recovery above the 50-day MA followed by a breakout above the $2.44 resistance would invalidate the bearish setup and could shift momentum back in favor of buyers.
Bottom Line
LayerZero’s recent drop reflects a confluence of bearish factors—notably large-holder distribution and weakening technical structure. While the project’s long-term fundamentals remain intact, short-term price action is increasingly driven by liquidity flows and key support levels. The $1.75 zone now stands as a critical line in the sand. A breakdown below it could accelerate losses, while a rebound may offer temporary relief.
Frequently Asked Questions
What is LayerZero (ZRO)?
LayerZero is an interoperability protocol that enables seamless communication between different blockchain networks.
Why did ZRO price drop today?
The drop was triggered by a large transfer of ZRO tokens from Alameda Research to Wintermute, increasing supply pressure.
What is the key support level for ZRO?
The immediate support lies near $1.75, which aligns with the 100-day moving average.
What is the downside target for ZRO?
If support breaks, the next major target is around $0.90, based on the current chart pattern.
What could invalidate the bearish outlook?
A strong reclaim of the 50-day MA ($1.89) and a breakout above $2.44 resistance would signal a potential trend reversal.
Disclaimer: The views and analysis presented in this article are for informational purposes only and reflect the author’s perspective, not financial advice. Technical patterns and indicators discussed are subject to market volatility and may or may not yield anticipated results. Investors are advised to exercise caution, conduct independent research, and make decisions aligned with their individual risk tolerance.