Welcome to your comprehensive deep-dive into one of the most subtle yet powerful signals in the world of price action trading: the Bullish Spinning Top. As your dedicated Candlestick Gems Manager, I am here to peel back the layers of this pattern. While some traders overlook it because of its small size, the Spinning Top is actually a "shouting" signal wrapped in a "whisper." It tells us that a massive tug-of-war is happening behind the scenes, and a major move might be just around the corner.
What Exactly is a Bullish Spinning Top?
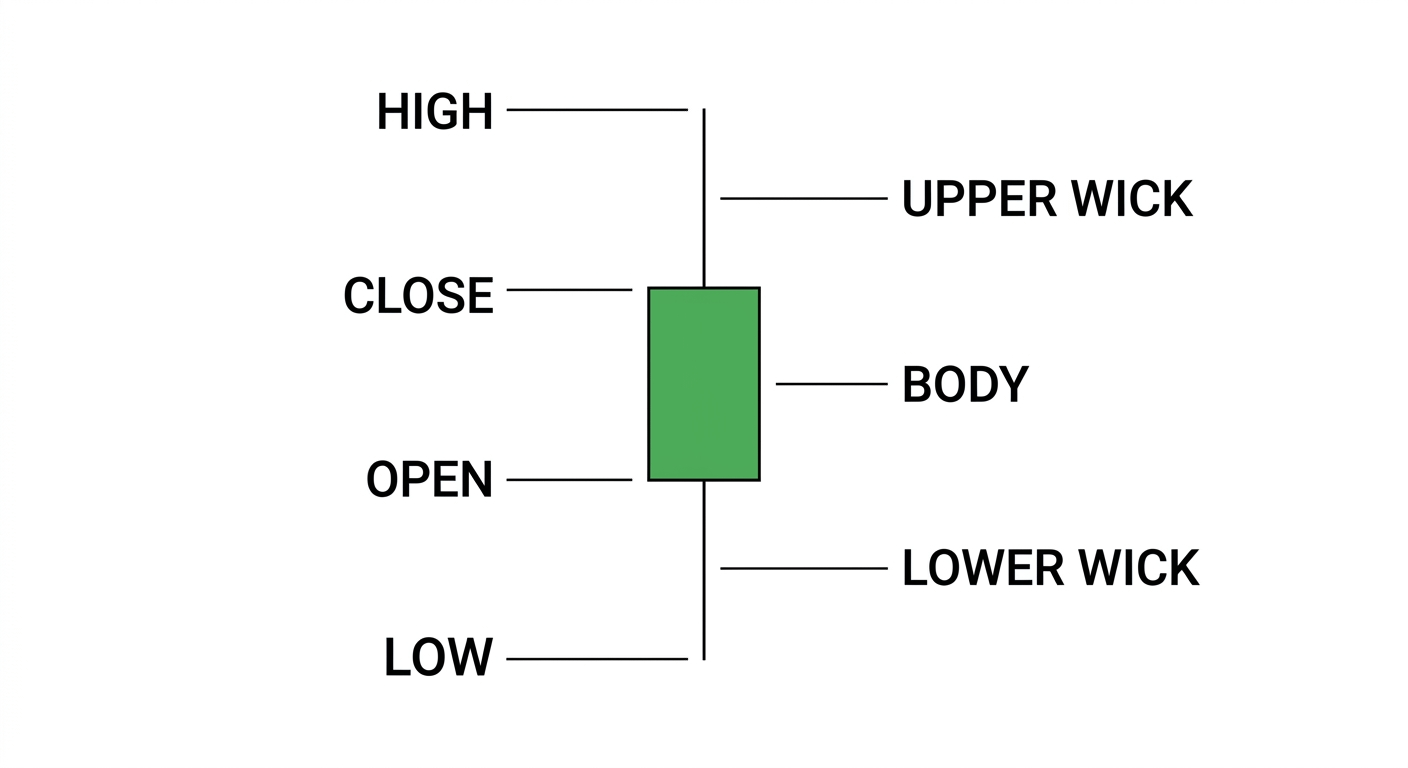
At its heart, a Bullish Spinning Top is a single-candle pattern characterized by its small real body and its long upper and lower shadows (wicks).
To visualize this, imagine a child's spinning top toy. It has a small center and sticks out on both ends. In trading, the "small center" is the price range between the open and the close, and the "sticks" are the distances the price traveled during the day before returning to the middle.
The Anatomy of the Pattern
To qualify as a true Bullish Spinning Top from our master list of 105 patterns, the candle must meet these specific visual criteria:
Small Real Body: The distance between the Open and the Close must be very narrow. This shows that despite all the volatility during the session, the price ended up almost exactly where it started.
Color: For it to be "Bullish," the Close must be slightly higher than the Open (usually a green or white candle). However, in the world of spinning tops, the color is often less important than the shape, though a green body gives the bulls a tiny psychological edge.
Long Upper Wick: The price pushed significantly higher during the session but was pushed back down.
Long Lower Wick: The price pushed significantly lower during the session but was pushed back up.
Symmetry: Ideally, the upper and lower wicks should be roughly equal in length, though they don't have to be perfect.
The Deep Psychology: What is the Market Thinking?
If you want to trade like a professional, you must stop seeing "lines and boxes" and start seeing human emotion. The Bullish Spinning Top is the ultimate symbol of Indecision.
Imagine a literal rope-pulling contest (Tug-of-War).
The Bulls (Buyers) pull with all their might, dragging the rope deep into their territory (creating the long upper wick).
The Bears (Sellers) scream and pull back, dragging the rope deep into their territory (creating the long lower wick).
The Result? After hours of sweating and pulling, the rope ends up exactly in the middle where it started.
This tells us two very important things:
Neither side is currently in control.
The previous trend (whether it was moving up or down) is losing its "oomph" or momentum.
When you see a Bullish Spinning Top after a long downtrend, it means the Sellers are getting tired, and the Buyers are finally starting to fight back effectively. The market is pausing to catch its breath and ask, "Where do we go next?"
Market Context: Location is Everything
A pattern is only as good as the neighborhood it lives in. You wouldn't wear a tuxedo to the beach, and you shouldn't trade a Spinning Top without looking at the surrounding candles.
1. The Potential Reversal (Bottom of a Trend)
If the market has been crashing down for several days and suddenly a Bullish Spinning Top appears, pay attention! The bears have been in total control, but this candle proves they can no longer push the price lower and keep it there.
Signal: The downward momentum is stalling.
Action: Look for a bullish "confirmation" candle next.
2. The Continuation (Middle of a Trend)
Sometimes, in a strong uptrend, the market needs a "rest day." A Bullish Spinning Top appearing during a climb suggests a temporary pause before the buyers gather their strength to push higher again.
3. At Resistance or Support
If a Bullish Spinning Top forms right at a major Support line, its reliability skyrockets. It acts as a "springboard" signal, showing that the floor is holding firm.
Reliability Factors: How to Spot a "High-Quality" Gem
Not all Spinning Tops are created equal. To find the ones worth your money, look for these "Power Boosters":
Wick Length: The longer the wicks relative to the body, the greater the indecision, and the more explosive the eventual breakout is likely to be.
Volume: If the volume is high during the formation of a Spinning Top, it means a massive amount of money changed hands, but the price didn't move. This suggests a "changing of the guard" between big institutional players.
Confirmation: This is the golden rule. Never trade a Spinning Top the moment it closes. Always wait for the next candle. If the next candle closes above the high of the Spinning Top, the "Indecision" has been resolved in favor of the Bulls.
Step-by-Step: How to Trade the Bullish Spinning Top
Let’s walk through a practical trading scenario so you can apply this immediately.
Identify the Trend: Look for a clear, existing downtrend. We want to see the bears getting exhausted.
Spot the Pattern: A candle forms with a tiny green body and long wicks on both sides.
Check the Surroundings: Is this happening near a Support level? Is the RSI showing "oversold" conditions? (If yes, the signal is stronger).
Wait for Confirmation: Do not enter yet. Wait for the very next candle. If that candle breaks and closes above the high of the Spinning Top's upper wick, that is your "Green Light."
Set Your Risk (Stop Loss): Place your Stop Loss just below the lowest point of the Spinning Top's bottom wick. If the price goes back down there, the pattern has failed.
Set Your Target (Take Profit): Look for the next major Resistance level or use a 2:1 reward-to-risk ratio.
Common Mistakes to Avoid
Even the best traders make mistakes with this pattern. Here is what to watch out for:
Mistake #1: Trading in a "Choppy" Market. If the chart is already messy and full of small candles, a Spinning Top means nothing. It only matters when it stands out after a clear move.
Mistake #2: Ignoring the Wicks. If the wicks are short, it’s just a "Small Day," not a Spinning Top. We need to see that the price tried to go far in both directions and failed.
Mistake #3: No Confirmation. Jumping in too early is the #1 way traders lose money on indecision patterns. The market might decide to continue the downtrend after the pause!
Real-Chart Story: The "Silent Turnaround"
Imagine a stock like Apple (AAPL) has been dropping for 5 days straight because of bad news. On day 6, the stock opens, drops 3%, then rallies 3%, then finally closes right back where it opened, up only 0.1%.
On your chart, this looks like a Bullish Spinning Top. The news is still bad, but the Price Action is telling you that everyone who wanted to sell has already sold. The sellers have "run out of bullets." When the sun rises the next day and the price starts to climb, the "Indecision" is over, and the new Bullish trend has begun.
Summary Table for Quick Reference
Feature Description
Category Single-Candle Pattern
Appearance Small green body, long upper/lower wicks
Market Mood Extreme Indecision / Neutral
Primary Function Potential Reversal (if after a trend)
Reliability Moderate (Requires confirmation)
Confirmation A close above the pattern's High
The Bullish Spinning Top is a gift of information. It tells you to stop, look, and listen because the market is about to make a choice. By waiting for the breakout and managing your risk, you turn market confusion into your personal profit.
By @MrJangKen • ID: 766881381 •
#CandlestickPatterns #TradingLessons #PriceAction #TechnicalAnalysis #LearnToTrade