As of April 2, 2026, #CTSI/USDT (@Cartesi ) continues to be a prominent Layer-2 scaling solution focused on bridging the gap between mainstream software development and the blockchain ecosystem. Below is a short analysis of the project and its recent market performance.
Project Analysis: Cartesi (CTSI)
1. Core Value Proposition
Cartesi differentiates itself by offering a Linux-based execution environment for decentralized applications (dApps). While most blockchains restrict developers to specific languages like Solidity, Cartesi allows them to build using familiar stacks such as Python, C++, Java, and Rust. This is achieved through the "Cartesi Machine," a virtual machine that emulates a RISC-V processor under a Linux OS.
2. Token Utility (CTSI)
The CTSI token is the backbone of the network's economy:
Staking:
The network uses a Proof-of-Stake (PoS) consensus where users stake CTSI to secure the network and earn rewards.
Transaction Fees:
It is used to pay for data processing and off-chain computations.
Governance:
Token holders can participate in the Cartesi DAO to vote on protocol upgrades and ecosystem funding
3. Recent Developments & Ecosystem
Cartesi has been moving toward "Stage 2" security on Layer-2 trackers (like L2BEAT), indicating high decentralization and security. Its focus has shifted significantly toward Application-Specific Rollups, which give each dApp its own high-performance CPU, avoiding the "noisy neighbor" problem common on shared networks like Ethereum
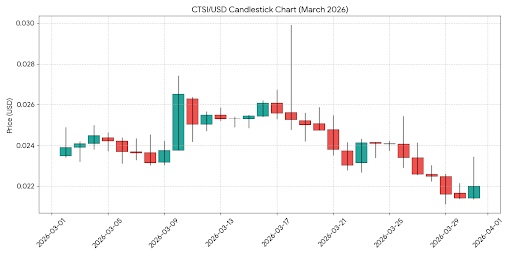
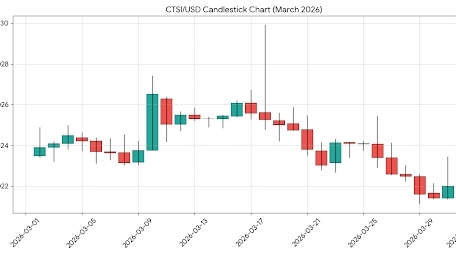
Market Performance & Technicals (March 2026)
The following candlestick chart illustrates CTSI's price action throughout March 2026.
Analysis of the Chart:
Volatility and Peaks:
The coin saw a significant mid-month spike, reaching a high of approximately $0.0299 on March 18th. This move was accompanied by a surge in trading volume, suggesting a temporary breakout attempt.
Correction and Support:
Following the peak, the price underwent a correction, finding a consolidation zone between $0.021 and $0.023 toward the end of the month.
Overall Trend:
Throughout March, the price exhibited a slight downward bias from its opening levels around $0.024, reflecting broader market sentiment. However, technical analysts often monitor these "falling" patterns for potential "wedge" breakouts, which are historically bullish reversal signals for the asset.