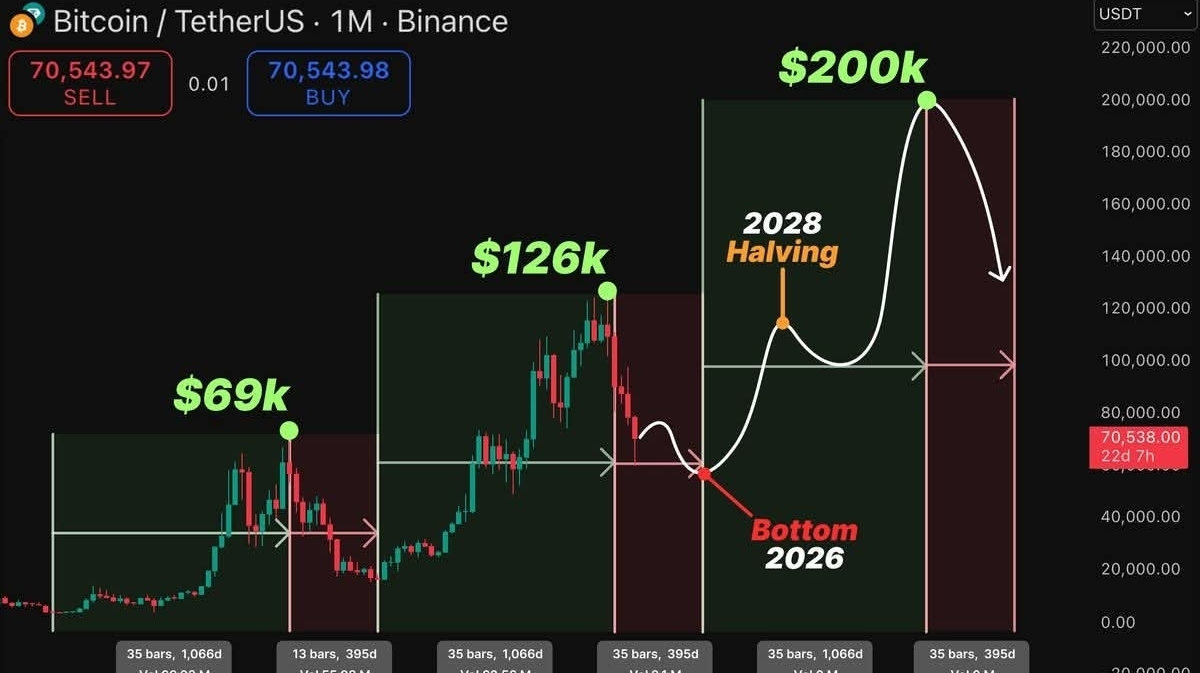
A historical timing pattern in #BitcoinCycles is getting attention again.
• Dec 2017 ATH → ~395 Days → Jan 2019 Bottom
• Nov 2021 ATH → ~395 Days → Dec 2022 Bottom
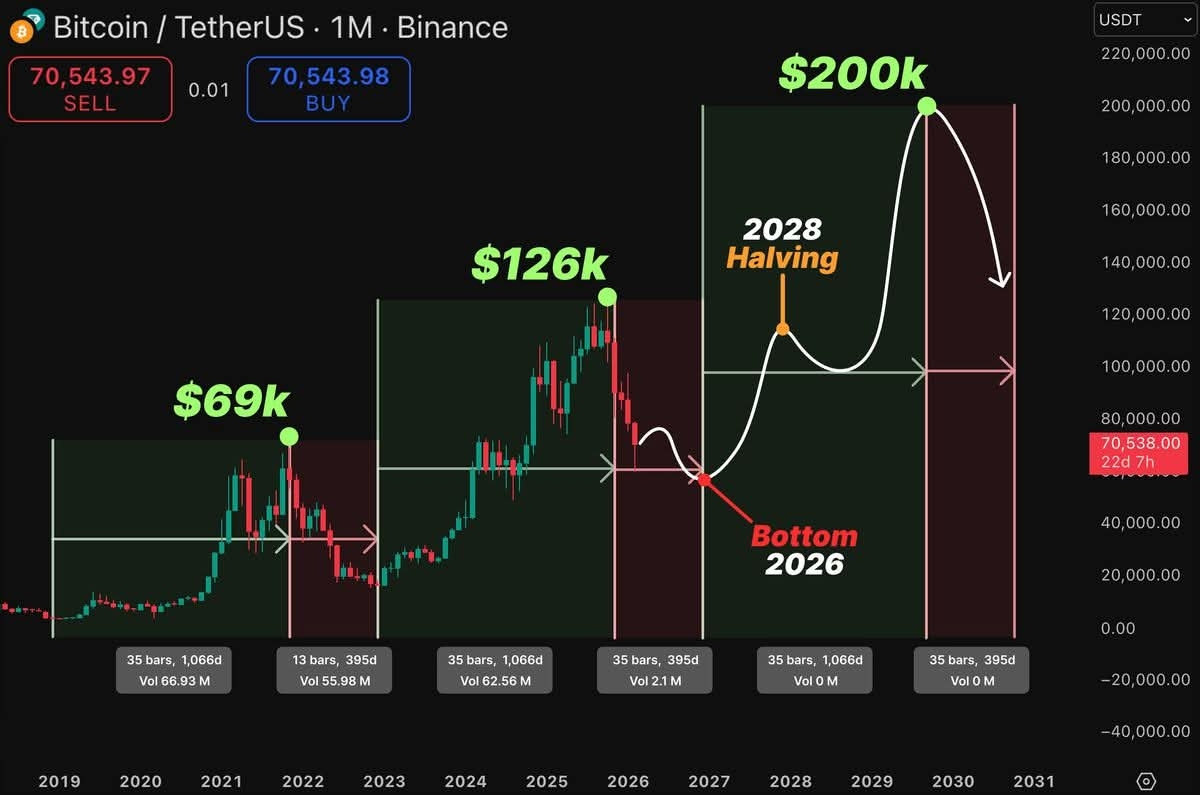
If the same structure repeats:
• Oct 2025 ATH → ~395 Days → Possible Bottom Around Nov 2026
Bitcoin markets often follow cyclical timing patterns driven by liquidity, sentiment, and macro conditions.
While no pattern guarantees the future, many traders are watching this timeline closely as a potential window for the next cycle bottom.
Trade $BTC here 👇

BTCUSDT
دائم
70,804
-0.91%
DYOR