
 Technical Analysis of the Chart (What Does It Mean?)
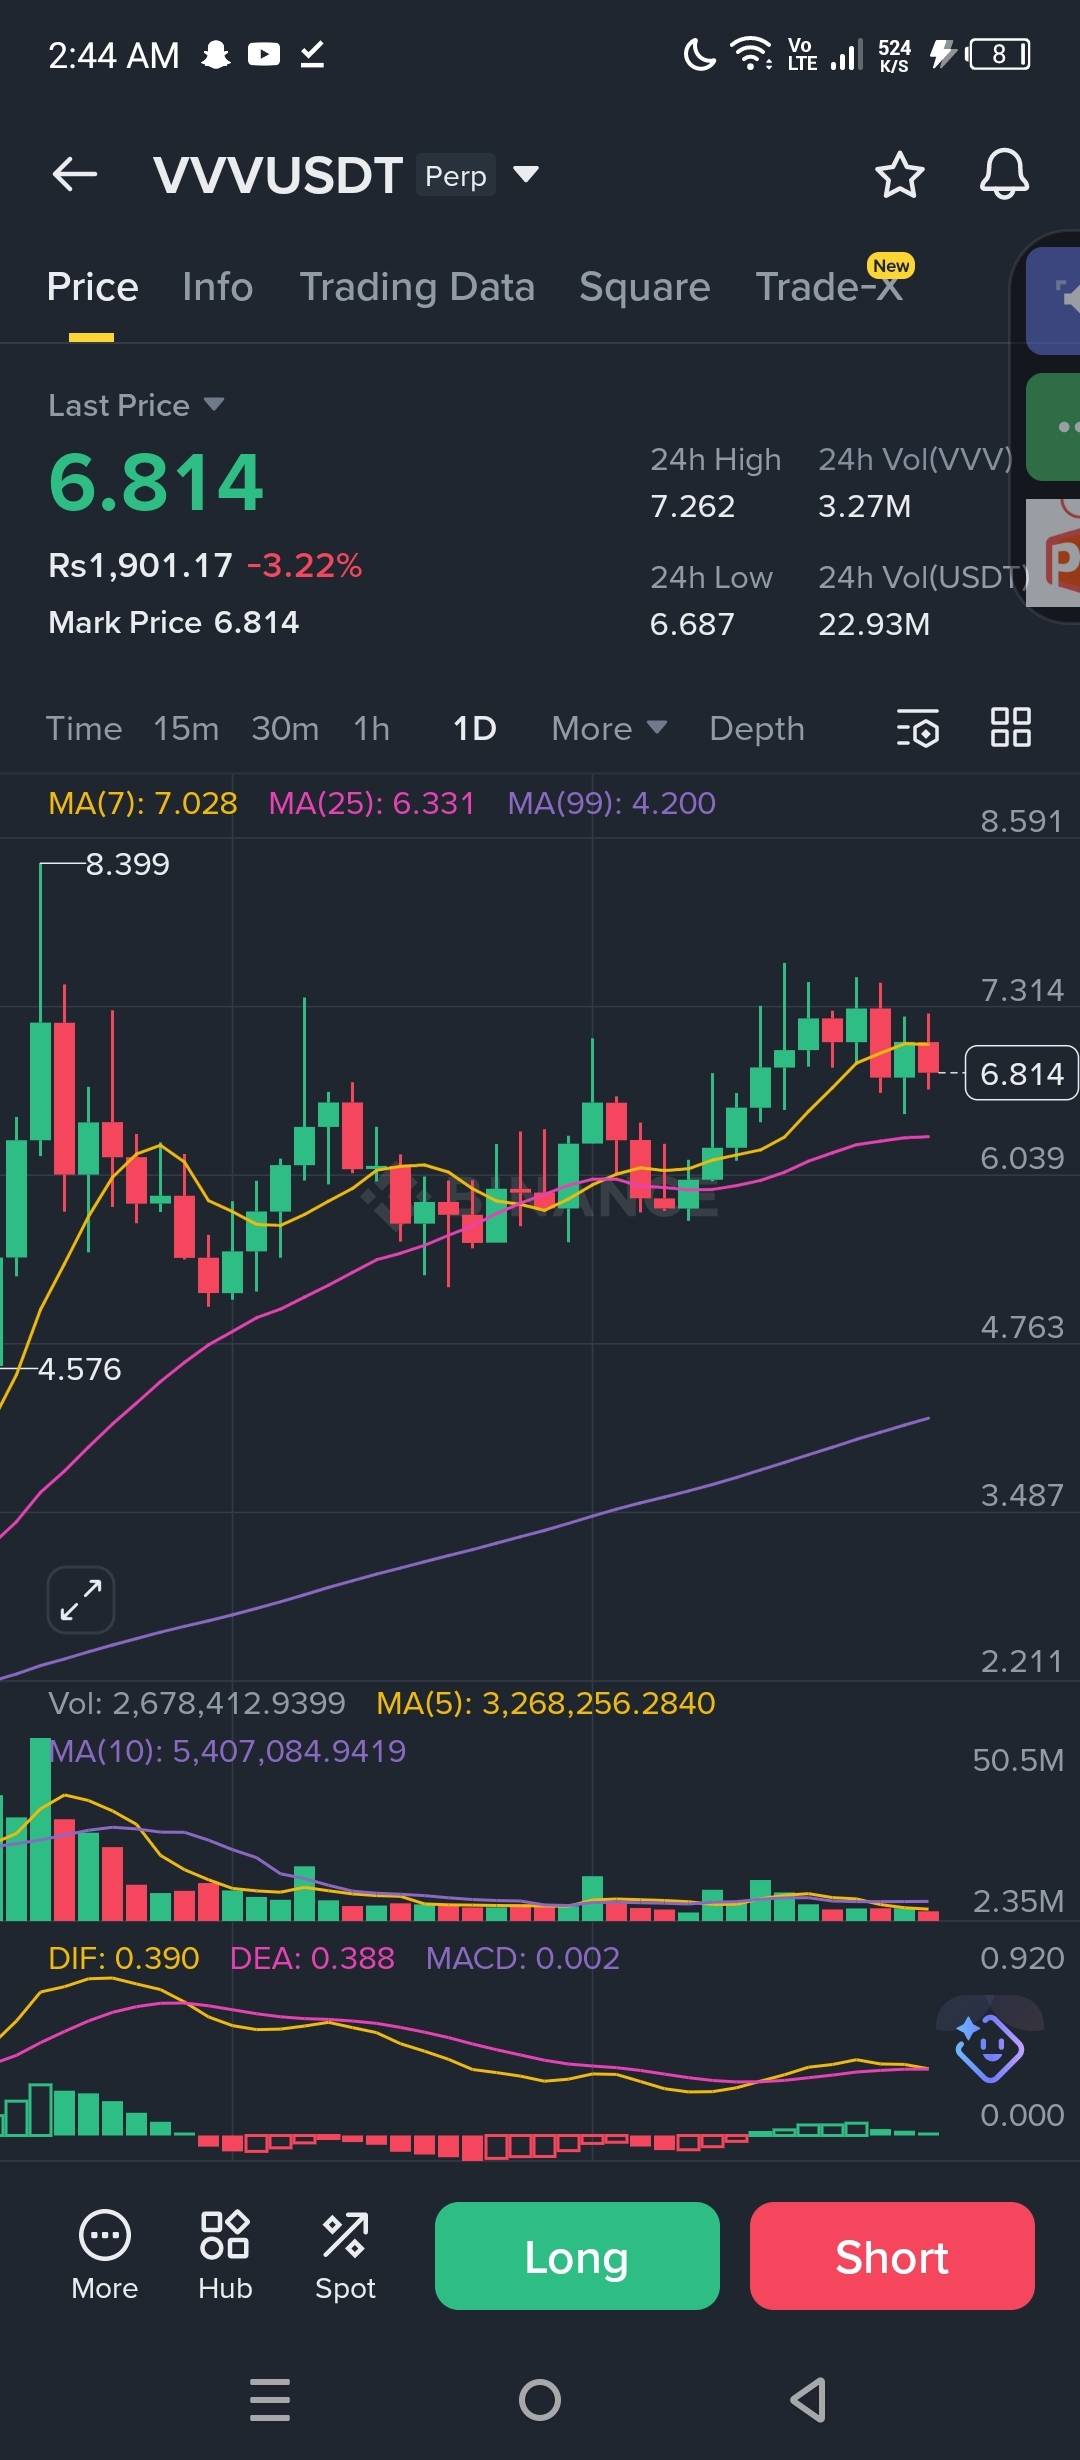
Price Action: VVV is currently trading at $6.814. The chart saw a significant rally over the past few days, taking it to $7.30, but now a slight correction is underway.
Support and Resistance:
Resistance ($7.20 - $7.30): This is the level from which the price has repeatedly retraced. Until VVV closes a candle above $7.30, further upside is unlikely.
Support ($6.33): The MA(25) (pink line) on your chart is at $6.33. If the price moves lower, this area could prevent it from falling.
Indicators (MACD): The MACD is weakening slightly towards the low (0.002), which indicates that the market may currently move "sideways" (neither too high nor too low).
Will it go up or down?
According to market experts and data from April 2026, the Venice Token (VVV) future is "Cautiously Bullish":
Bullish Risks: VVV is an AI-based project and recently burned its token supply. If it breaks the $7.20 supply zone, the next target could be $7.80 to $8.00.
Bearish Risks: If Bitcoin or the overall market falls, VVV could fall back to $6.30 or even as low as #VVV $VVV
