The Relative Strength Index, commonly abbreviated as **RSI**, is one of the most famous and important momentum indicators in technical analysis. This indicator measures the speed and magnitude of recent price changes and oscillates on a scale ranging between 0 and 100.
Here is how to use this indicator to build effective trading strategies:
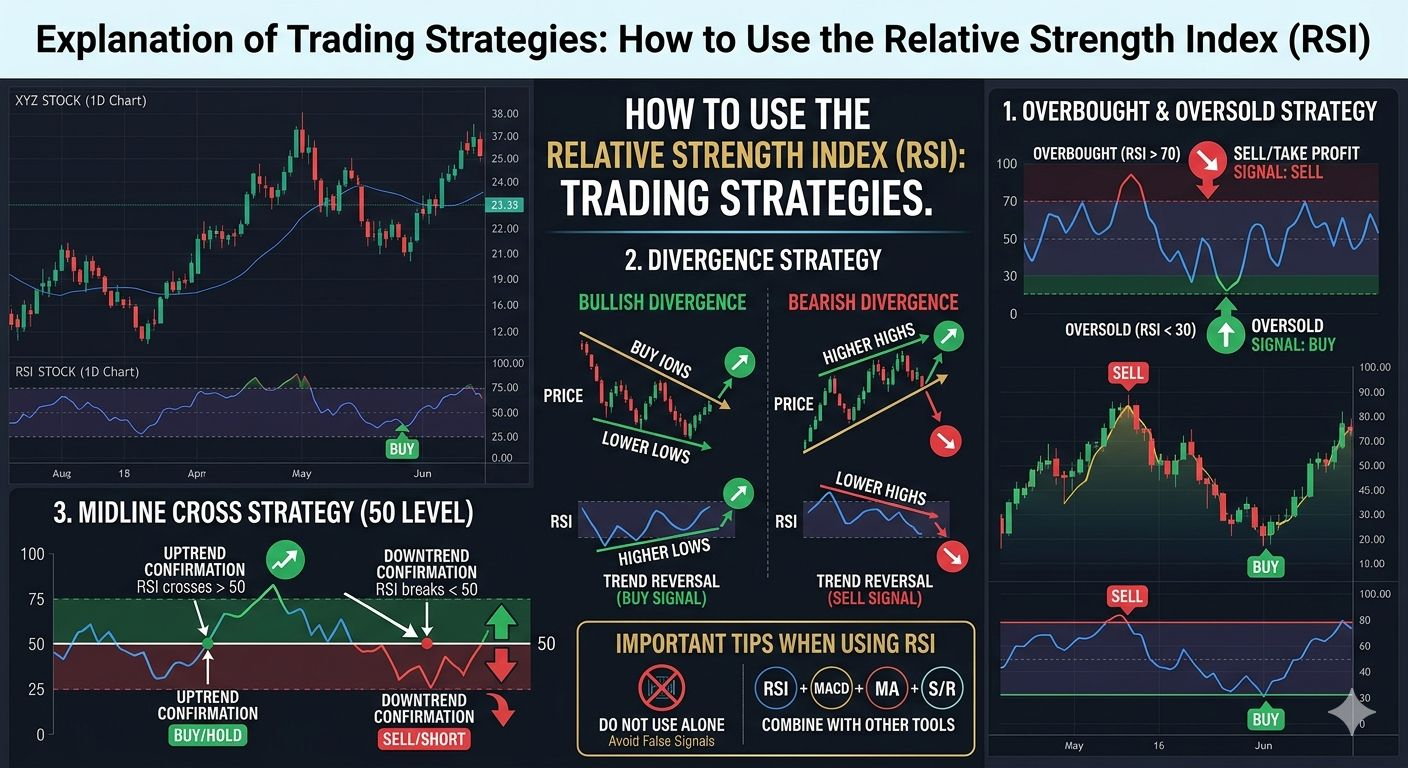
### 1. Overbought & Oversold Strategy
This is the fundamental and most common way to use the RSI indicator, relying on two key levels: **70** and **30**.
* **Overbought - Above the 70 level:**
When the RSI line rises to cross the 70 level, the financial asset (stock, cryptocurrency, etc.) is considered "overbought." This means the price has risen sharply and rapidly, and a downward correction or trend reversal might be imminent.
* **Trading Signal:** A potential opportunity to sell (Short) or take profits.
* **Oversold - Below the 30 level:**
When the RSI line drops below the 30 level, the asset is considered "oversold." This indicates that the price has dropped excessively, and an upward bounce might be imminent.
* **Trading Signal:** A potential opportunity to buy (Long).
### 2. Divergence Strategy
The divergence strategy is considered one of the most powerful advanced strategies. It occurs when the price moves in the opposite direction of the RSI indicator, providing early signals of a trend reversal.
* **Bullish Divergence:**
Occurs when the price records "Lower Lows," while the RSI records "Higher Lows." This means the downward momentum is weakening, and buyers might soon take control to push the price up.
* **Bearish Divergence:**
Occurs when the price records "Higher Highs," while the RSI records "Lower Highs." This indicates that the upward momentum is fading, and the price might drop soon.
### 3. Midline Cross Strategy (50 Level)
The **50** line in the RSI indicator acts as a dividing line between an uptrend and a downtrend.
* **Uptrend Confirmation:** When the indicator crosses the 50 level upwards and stabilizes above it, this indicates buyer control and a general upward trend.
* **Downtrend Confirmation:** When the indicator breaks the 50 level downwards and stabilizes below it, this indicates seller control and a general downward trend.
### 💡 Important Tips When Using RSI:
* **Do not use it alone:** The RSI is an excellent indicator, but it can provide false signals, especially in strongly trending markets. In a strong uptrend, the indicator might stay above 70 for an extended period without the price dropping.
* **Combine with other tools:** It is always preferable to combine the RSI with other indicators like Moving Averages or the MACD, in addition to considering support
and resistance levels.