— FULL TECHNICAL ANALYSIS | April 17, 2026 Multi-Timeframe: 5M | 15M | 4H
🔥 Price: $2,452.43 | Mark: $2,451.51 | +6.18% 🚀 ≈ Rs 683,786 | 24h High: $2,456.32 | 24h Low: $2,305.18
🕯️ CANDLESTICK & CHART STRUCTURE
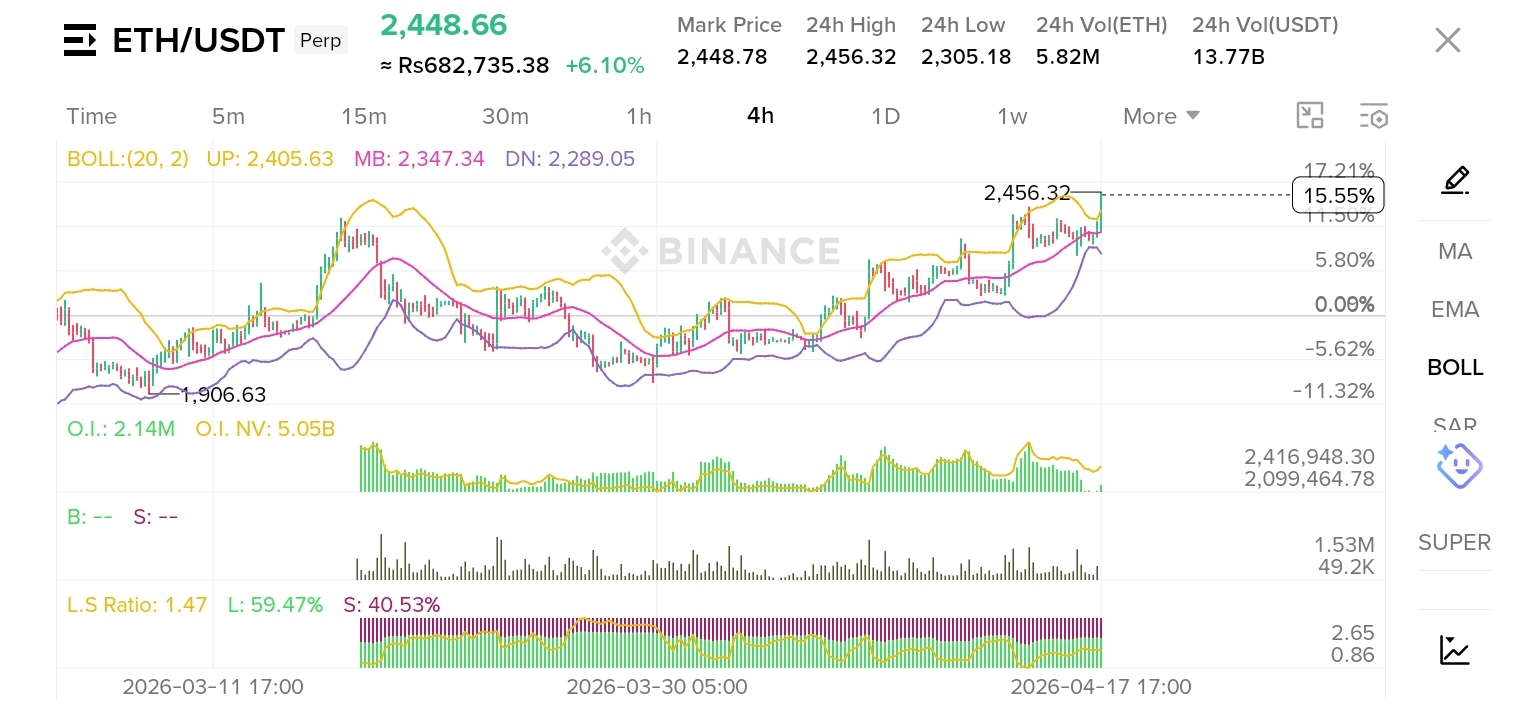
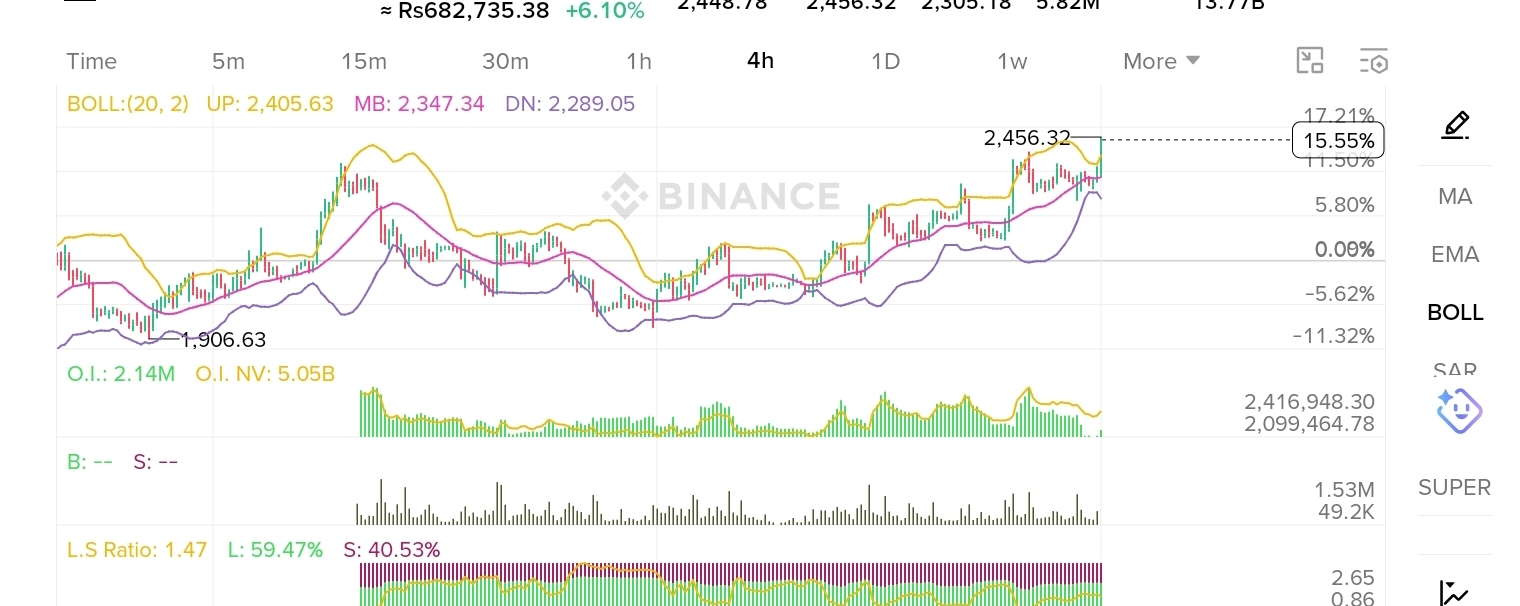
📌 4H Timeframe (Big Picture): ETH broke out of a long consolidation range (1,906–2,350) with strong bullish momentum. Multiple bullish engulfing candles formed as price reclaimed the Upper Bollinger Band and closed above it — a textbook continuation signal. Price has been making Higher Highs & Higher Lows since April 10.
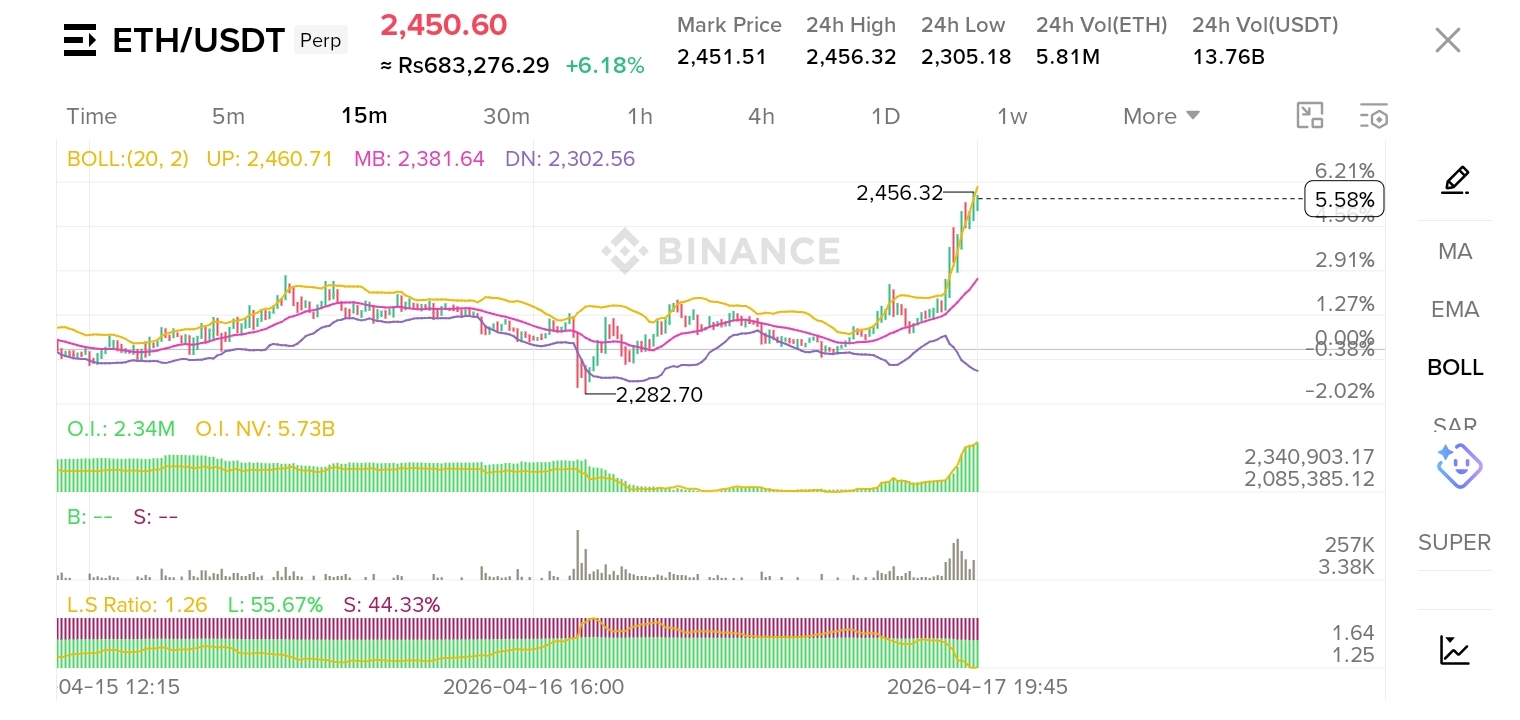
📌 15M Timeframe (Swing View): After a brief pullback to 2,282.70, bulls stepped inhard. Clean breakout candles with expanding bodies — no major upper wicks = strong buyer control. Price is riding the Upper BB aggressively.
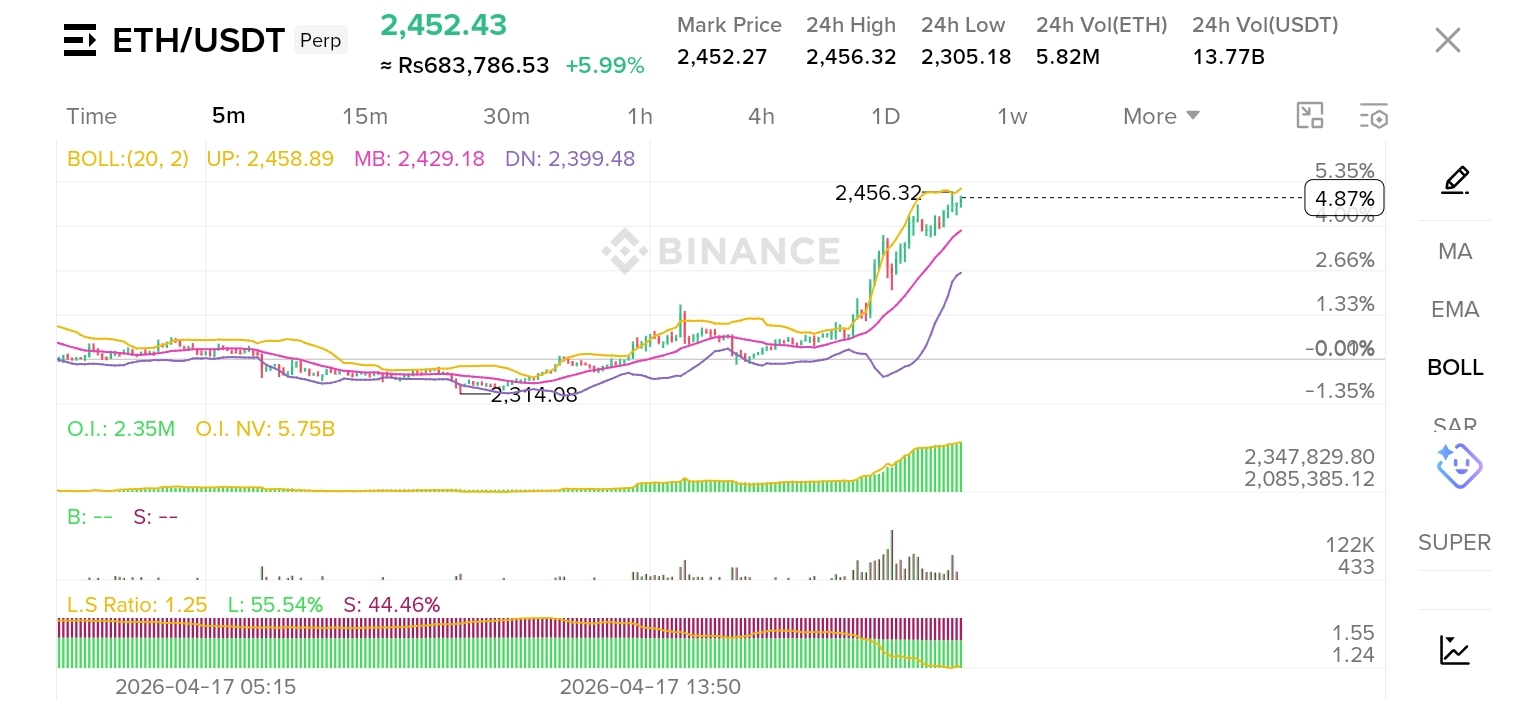
📌 5M Timeframe (Scalp View): Explosive breakout from 2,314 to 2,456 in one session. Strong green candles with minimal pullbacks. Price near 5M Upper BB (2,458.89) — micro consolidation expected before next push.
━━ 📉 BOLLINGER BANDS (20, 2) — ALL TFs
✅ Price is above Upper BB on ALL timeframes = extreme bullish momentum. BB bandwidth expanding = trending market, not ranging.
━ 📈RSI ANALYSIS ━
🔴 4H RSI: ~72–75 → Overbought zone 🟡 15M RSI: ~68–72 → Approaching overbought 🟢 5M RSI: ~65–70 → Hot but still room to run
⚠️ RSI overbought doesn't mean reversal — in strong trends RSI can stay 70+ for hours. Watch for bearish divergence (price higher but RSI lower) as the key reversal warning signal.
━━ 📦 VOLUME & OPEN INTEREST ━━
📊 24h Volume (ETH): 5.82M 💵 24h Volume (USDT): $13.77 Billion 📈 Open Interest: 2.35M ETH | $5.75B
OI is RISING sharply on 5M chart — new positions being opened during the pump = genuine breakout, not a short squeeze fakeout.
Volume spike confirms: institutions + retail piling in. This is real buying pressure. 💪
━━━⚖️ LONG/SHORT RATIO ━━
✅ Bulls in control on ALL timeframes. L/S ratio 1.47 on 4H = strong institutional long bias.
━━ 🟢 ENTRY POINTS ━━━
🎯 Aggressive Entry (Current): $2,430–2,440 → Retest of 5M Middle BB on any dip
🎯 Safe/Retracement Entry: $2,380–2,400 → 15M Middle BB + previous resistance turned support
🎯 Strong Demand Entry: $2,305–2,320 → 24h Low / major support zone
🎯 Breakout Continuation Entry: Above $2,456.32 (new 24h High break) → Confirmed with strong volume candle clo
━━━━ 🔴 EXIT / TAKE PROFIT LEV━━━━━━━
💰 TP1: $2,460–2,470 (5M & 15M Upper BB resistance) 💰 TP2: $2,520–2,550 (Psychological + next fib level) 💰 TP3: $2,620–2,650 (Major resistance from Feb highs) 💰 TP4: $2,800+ (Full trend target if breakout sustains)
━━ ⛔ STOP LOSS LEVELS ━━━
🛑 Scalp SL: Below $2,399 (5M Lower BB) 🛑 Swing SL: Below $2,302 (15M Lower BB) 🛑 Position SL: Below $2,289 (4H Lower BB) 🛑 Hard SL: Below $2,250 (Market structure break)
━━━━━ 💥 LIQUIDATION ZONES ━━━━━━
🔴 Short Liquidations (Above): • $2,460–2,500 → Short squeeze fuel 🚀 • $2,550–2,600 → Cascading short liquidations
🟢 Long Liquidations (Below): • $2,380–2,400 → Weak longs get flushed • $2,300–2,320 →Heavy long liquidation zone • $2,240–2,250 → Capitulation zone
📌 With OI at $5.75B, a move above $2,460 will trigger a short squeeze cascade pushing price rapidly toward $2,520+
━━━━ 🔮 SUPERTREND & SAR (Parabolic ━━━
✅ Supertrend: BULLISH on all TFs (price above green line) ✅ Parabolic SAR: BELOW price on 4H & 15M = trend continuation signal ⚠️ 5M SAR: Watch for flip if price consolidates at current levels
━━━━ 📋 OVERALL BIAS: BULLISH 🟢 ━━━━━━━━━━━━━━━━━━━━━━━
✅ Price above ALL Bollinger Bands ✅ Rising OI = new money entering ✅ L/S Ratio favoring bulls (1.47) ✅ Volume surge confirms breakout ✅ Supertrend & SAR bullish aligned ⚠️ RSI overbought — watch for healthy pullback to $2,380–2,400 for next entryNext major target: $2,520 → $2,650 🎯
━━ ⚠️ Not financial advice. Always use proper risk management. Trade what you can afford to lose.
Drop your ETH target below! 👇 ❤️ Like | 🔔 Follow | 📌 Pin this post
#ETH🔥🔥🔥🔥🔥🔥 #Ethereum #ETHUSDT #ETHPerp #cryptotrading #BinanceSquar e #TechnicalAnalysis #RSI#CryptoSignals #OpenInterest #LongShort #LiquidationZones #EntryPoint #ExitPoint #CryptoBul