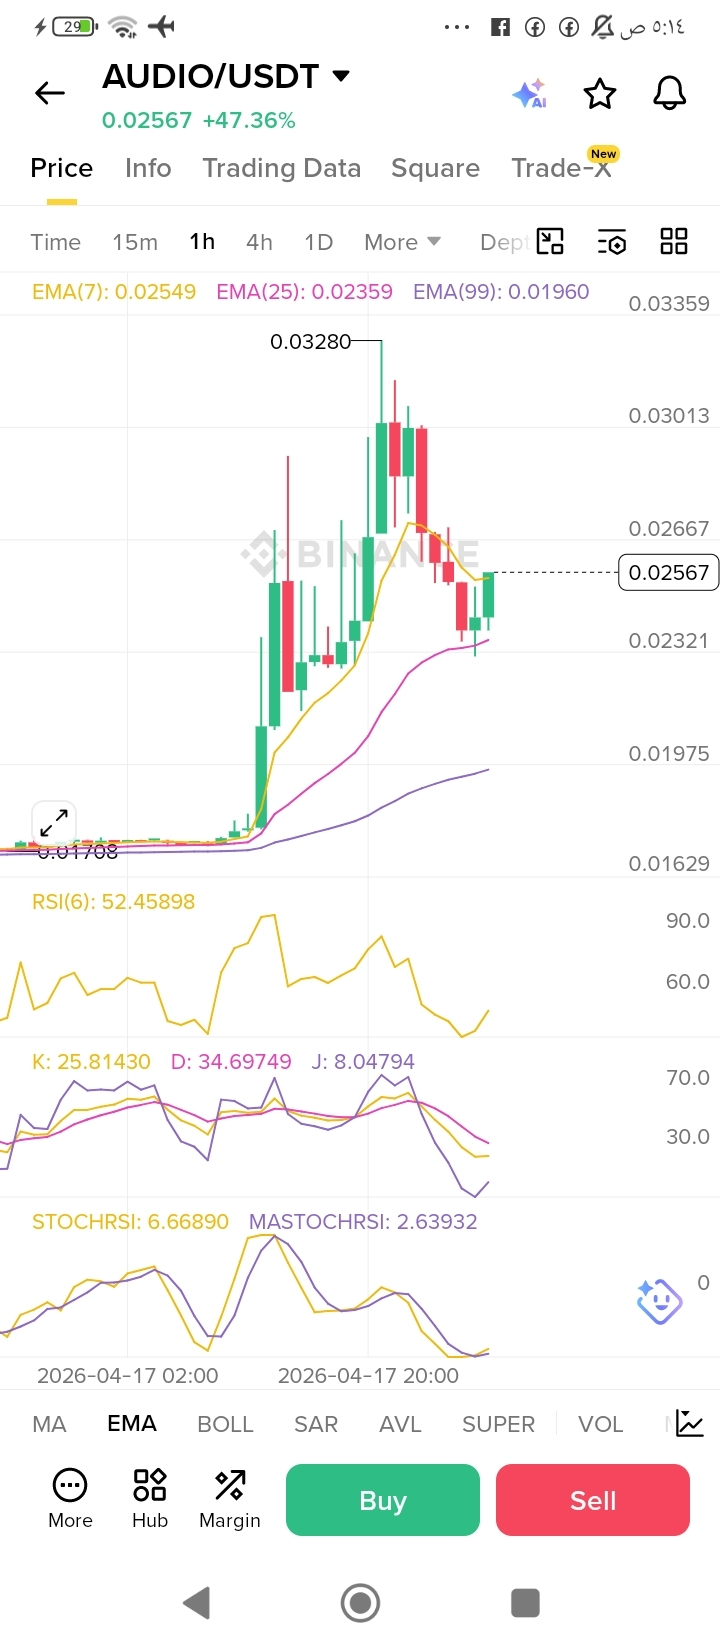
1. Price Action & Trend
Bullish Surge: The pair experienced a massive breakout, rallying over 47% from the 0.017 base to a local peak of 0.03280.
Correction Phase: After hitting the peak, the price entered a healthy correction. The most recent candles show the price finding support near the EMA 25 (purple line), suggesting that buyers are stepping back in.
2. Moving Averages (EMA)
EMA 7 (Yellow - 0.02549): The price is currently fighting to stay above this short-term line. Staying above it is crucial for immediate bullish momentum.
EMA 25 (Purple - 0.02359): This acted as dynamic support during the recent dip. As long as the price holds above this level, the mid-term trend remains bullish.
EMA 99 (Blue - 0.01960): This is the "ultimate" support. A drop below this would signal a trend reversal.
3. Technical Indicators
RSI (6): Currently at 52.45. It has cooled down from "overbought" levels and is now in neutral territory, meaning the market is catching its breath.
KDJ: The lines are beginning to converge at the bottom, suggesting a potential bullish crossover. This is often a signal that the selling pressure is exhausting.
Stochastic RSI: This is the most notable signal. It is currently in the oversold zone (near 6.6) and starting to curve upward. Historically, this indicates a high probability of a price bounce in the near future.
4. Key Levels to Watch
Level Type Significance
0.03280 Major Resistance The recent high. Breaking this confirms a continuation of the rally.
0.02667 Minor Resistance A psychological hurdle the price needs to clear to regain full strength.
0.02350 Immediate Support Confluence
Summary & Outlook
The chart shows a bullish consolidation. The aggressive "pump" has ended, and the market is now deciding its next move. Because the Stochastic RSI is deeply oversold, a relief rally or a second leg up toward $0.028 - $0.030 is likely, provided Bitcoin remains stable.
Bullish Scenario: If it holds above 0.025, look for a retest of the 0.032 area.
Bearish Scenario: An hourly close below 0.023 could lead to a deeper retracement toward the 0.020 support zone.