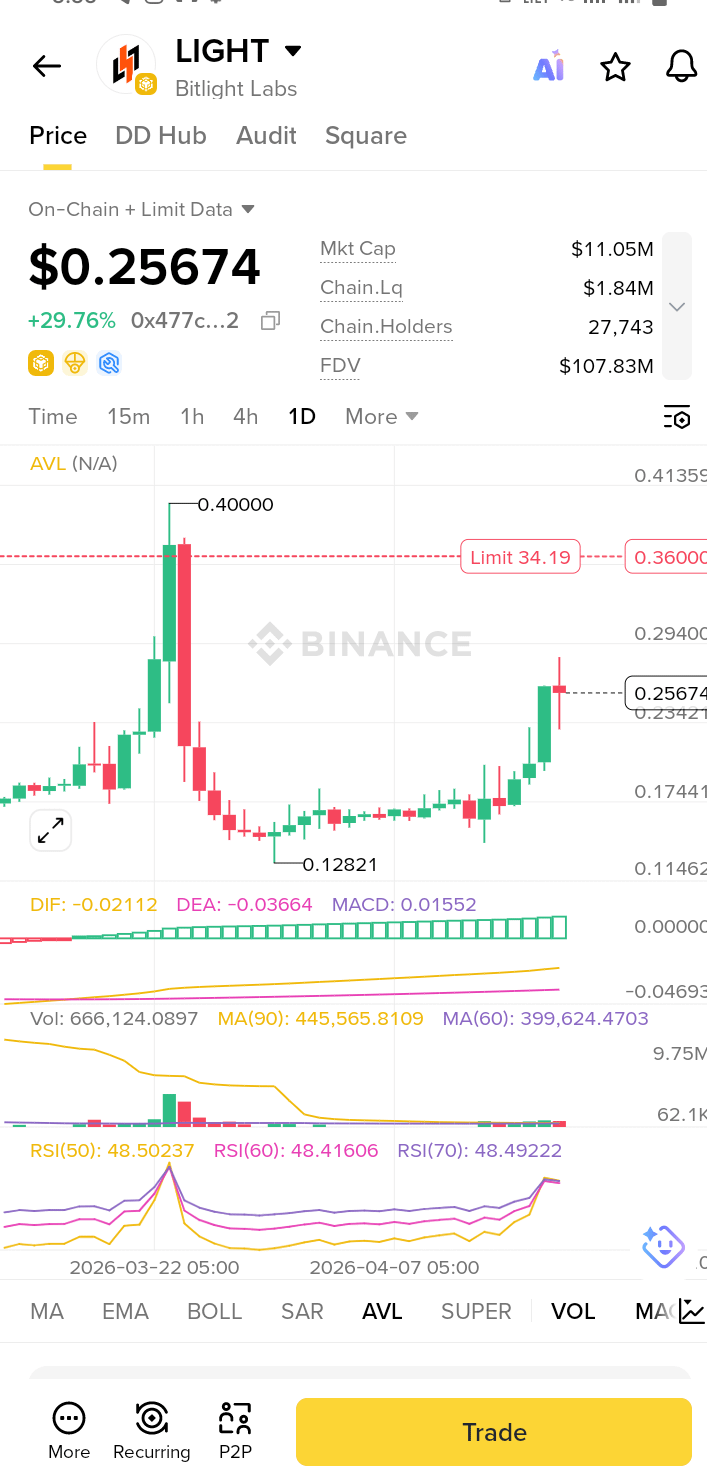
LIGHT/USDT Technical Analysis - 1D Chart, Binance
1. Market Data Snapshot
Metric Value Interpretation
Price \$0.25674 +29.76% today - strong
 bullish day
Market Cap \$11.05M Micro-cap. High volatility risk
FDV \$107.83M 9.7x MC. ~90% supply not in circulation yet
Liquidity \$1.84M Low. Expect high slippage on large orders
Holders 27,743 Small holder base
ATH \$0.40000 ~56% above current price
ATL/Base \$0.12821 +100% from bottom already
2. Indicator Analysis
RSI(50/60/70): 48.41 - 48.50
All RSI lines are below 50 but curling up sharply. This indicates bearish-to-neutral momentum shifting toward bullish. A break above 50 confirms buyer control. Not overbought yet, so room to run.
MACD: DIF -0.0211, DEA -0.0366, Histogram +0.0155
This is key: DIF > DEA and histogram is positive = bullish crossover occurred. MACD is still below 0 line, meaning long-term trend is not confirmed bullish yet, but short-term momentum just flipped bullish. Histogram bars expanding = momentum accelerating.
Volume: 666K vs MA(90) 445K, MA(60) 399K
Today's volume is 50% above 90-day average. Unlike BEAT, this pump has volume backing it. The initial move from $0.17 to $0.25 had big green volume spikes. Shows genuine demand, not just low-liq wick.
3. Price Structure & Key Levels
1. Macro Structure: Classic "pump and dump" pattern. $0.40 → $0.128 = -68% crash. Then 2-week accumulation base at $0.128 - $0.17. Now breakout phase.
2. Current Structure: Broke out of base with 2 strong green candles. Retested $0.23 and bounced = bullish retest.
Level Type Price Zone Significance
Major Resistance \$0.3600 "Limit 34.19" line + psychological
Minor Resistance \$0.2940 - \$0.3000 Wick high of recent candle
Immediate Resistance \$0.2600 - \$0.2700 Current battle zone
Immediate Support \$0.2342 Last breakout point
Strong Support \$0.1744 Base top
Major Support \$0.1282 ATL. Break = trend failure
4. Trade Scenarios
Bullish Continuation - Primary Bias:
The MACD cross + volume + RSI rising from lows is a classic trend reversal setup.
1. Entry 1: On retest of $0.23 - $0.24 support
2. Entry 2: Breakout and close above $0.27 with volume
3. Targets: T1 = $0.294, T2 = $0.36, T3 = $0.40 ATH retest
4. Stop Loss: Below $0.22 or $0.17 for swing trades
5. Invalidation: Daily close below $0.174
Bearish Rejection - Risk Case:
$0.26 - $0.30 is where the dump started last time. Many bagholders from $0.40 may sell here.
1. Entry: Rejection wicks at $0.29 + RSI fails to cross 60
2. Targets: T1 = $0.23, T2 = $0.17, T3 = $0.128
3. Stop Loss: Above $0.305
Range Case:
If rejected at $0.29 but holds $0.23, expect $0.23 - $0.29 range for accumulation before next leg.
5. Critical Risks for LIGHT
1. FDV Risk: FDV is 9.7x market cap. Token unlocks/vestings will create constant sell pressure. Check vesting schedule before holding long term.
2. Low Liquidity: $1.84M liquidity means a $50k sell order can drop price 5-8%. Not suitable for large size.
3. Micro-cap Volatility: +/-30% days are normal. Position size accordingly.
4. New Token: Chart only shows 1 month data. No long-term history = higher risk.
6. Confluence Summary
Bullish Bearish
MACD bullish cross confirmed Major resistance \$0.29-\$0.36 ahead
Volume above average on breakout FDV 9.7x MC = dilution risk
Broke + retested \$0.23 support Low liquidity, micro-cap
RSI rising from oversold, not overbought ATH bagholders waiting to exit
Bottom Line: LIGHT just printed a technically strong bullish reversal with MACD cross + volume. Short-term momentum favors upside toward $0.294 then $0.36. However, it’s a micro-cap with 90% tokens still locked, so moves will be violent both ways.
Strategy: Only trade with strict risk. If bullish, buy pullbacks to $0.23-$0.24, SL $0.21. If $0.27 breaks with volume, target $0.36. Take profits early - micro-caps don’t trend cleanly.
Disclaimer: Not financial advice. Micro-cap tokens can lose 80% in a day. Never risk more than you can afford to lose.
Are you holding LIGHT or planning entry? Tell me your position size and I’ll calculate exact R:R and risk for you.