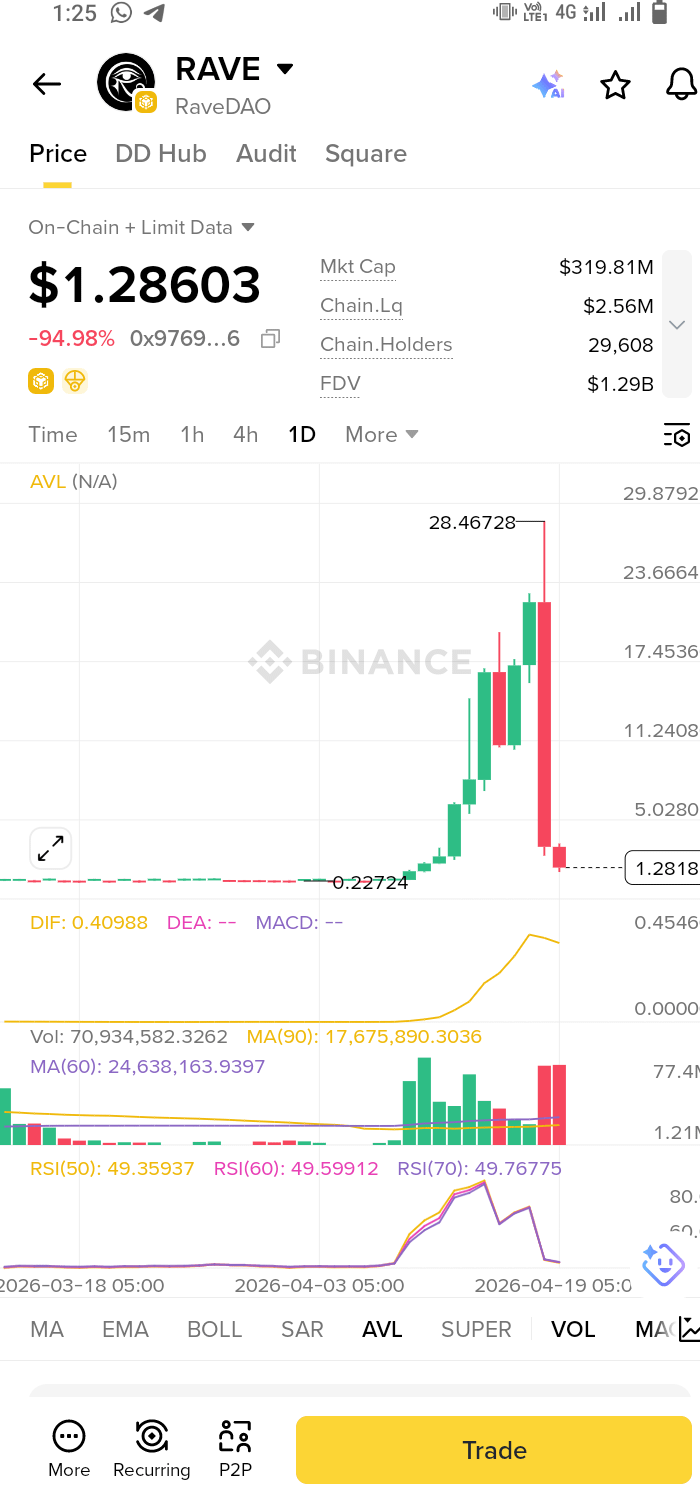
RAVE/USDT Technical Analysis - 1D Chart, Binance
1. Market Data - 19 April 2026
Metric Value Red Flags
Price \$1.28603 -94.98% from recent high
Market Cap \$319.81M Mid-cap but dumped hard
FDV \$1.29B 4x MC. 75% supply still locked
Liquidity \$2.56M Very low for \$319M MC
Holders 29,608 Decent but likely many trapped
High \$28.46728 Dumped 95.5% in days
Low/Base \$0.22724 +466% from base, then crashed
2. Indicator Breakdown
RSI(50/60/70): 49.35 - 49.76
Dropped from 80+ overbought straight to below 50. Shows momentum completely collapsed. Below 50 = sellers control. If 40 breaks, next leg down starts.
MACD: DIF 0.40988, DEA: --, MACD: --
DIF still positive but DEA/MACD blank means death cross just happened or about to. Histogram not visible but price action shows massive bearish momentum. Lagging indicator - damage already done.
Volume: 70.9M vs MA(90) 17.6M, MA(60) 24.6M
Volume is 3x-4x normal average. This is distribution volume - whales dumping into retail FOMO. Big red volume bars on the crash confirm this. Current volume still high = dump not over.
3. Price Structure - Classic "Pump & Dump"
1. Phase 1 - Accumulation: $0.22 base for weeks. Dead chart, no one watching.
2. Phase 2 - Markup/Pump: $0.22 → $28.46 = 12,800% in ∼15 days. Parabolic blow-off top.
3. Phase 3 - Distribution/Dump: One massive red candle $28.46 → $1.28 = -95.5% in 2-3 days. This is a rug-style move.
4. Phase 4 - Now: Dead cat bounce attempt at $1.28.
4. Key Levels
Level Type Price Zone Why It Matters
Major Resistance \$5.02 - \$11.24 Gap zone, lots of trapped buyers
Minor Resistance \$1.80 - \$2.20 Small bounce area on dump
Current Price \$1.286 No support here, free fall zone
Psychological Support \$1.00 Round number. Won’t hold without news
Strong Support \$0.45 Old consolidation before pump
Major Support/Base \$0.22724 Launch base. If this breaks, project dead
5. Trade Scenarios
Bearish Continuation - 80% Probability:
This is the most likely path after a 95% dump.
1. Reason: No support built, FDV 4x MC, low liquidity, holders trapped
2. Targets: T1 = $1.00, T2 = $0.45, T3 = $0.22 back to base
3. Stop Loss: Above $1.50 if shorting
4. Trigger: Any bounce toward $1.80 gets sold hard
Bullish/Bounce Case - 20% Probability:
Needs V-shape recovery which is rare after -95%.
1. Confirmation Needed: Daily close above $2.20 with volume >100M
2. Entry: Only above $2.50 to avoid bull trap
3. Targets: T1 = $5.00, T2 = $11.24
4. Stop Loss: $1.20
5. Reality Check: 99% of coins that dump 95% never recover ATH
Do Not Buy Support Yet:
$1.00 and $0.45 look like support but in these dumps they cut through like butter. Wait for base formation + weeks of sideways.
6. Critical Warnings for RAVE
1. Rug Pull Signature: 12,800% pump + 95% dump in 3 days with 4x FDV/MC ratio is textbook pump & dump. Team/VCs likely dumped vested tokens.
2. Liquidity Trap: Only $2.56M liquidity for $319M MC. If 10% of holders sell, price goes to $0.10. You cannot exit big size.
3. No Technical Bottom: RSI not oversold, MACD not bottomed, no base built. Falling knife situation.
4. Bagholder Pressure: Anyone who bought above $5 is down 75%+. They will sell any bounce to cut losses.
Bottom Line
RAVE is a completed pump & dump. Went $0.22 → $28.46 → $1.28. Charts like this have 95% chance of bleeding back to base at $0.22 over next 1-3 months. Any bounce is for selling, not buying.
Strategy:
1. If Holding: Sell bounces to $1.50-$1.80. Don’t hope for ATH again.
2. If Not In: Do NOT long here. If you want to gamble, wait for $0.25-$0.30 zone and only with money you can burn.
3. Short: High risk due to low liquidity. Can get wick liquidated. Avoid.
Disclaimer: Not financial advice. This is a high-risk microcap with rug characteristics. 90%+ chance it goes lower. Protect capital.
RAVE hold kiya hua hai kya? Kitne pe entry li thi? Batao to exit plan bana deta hu.