🗓 April 21, 2026
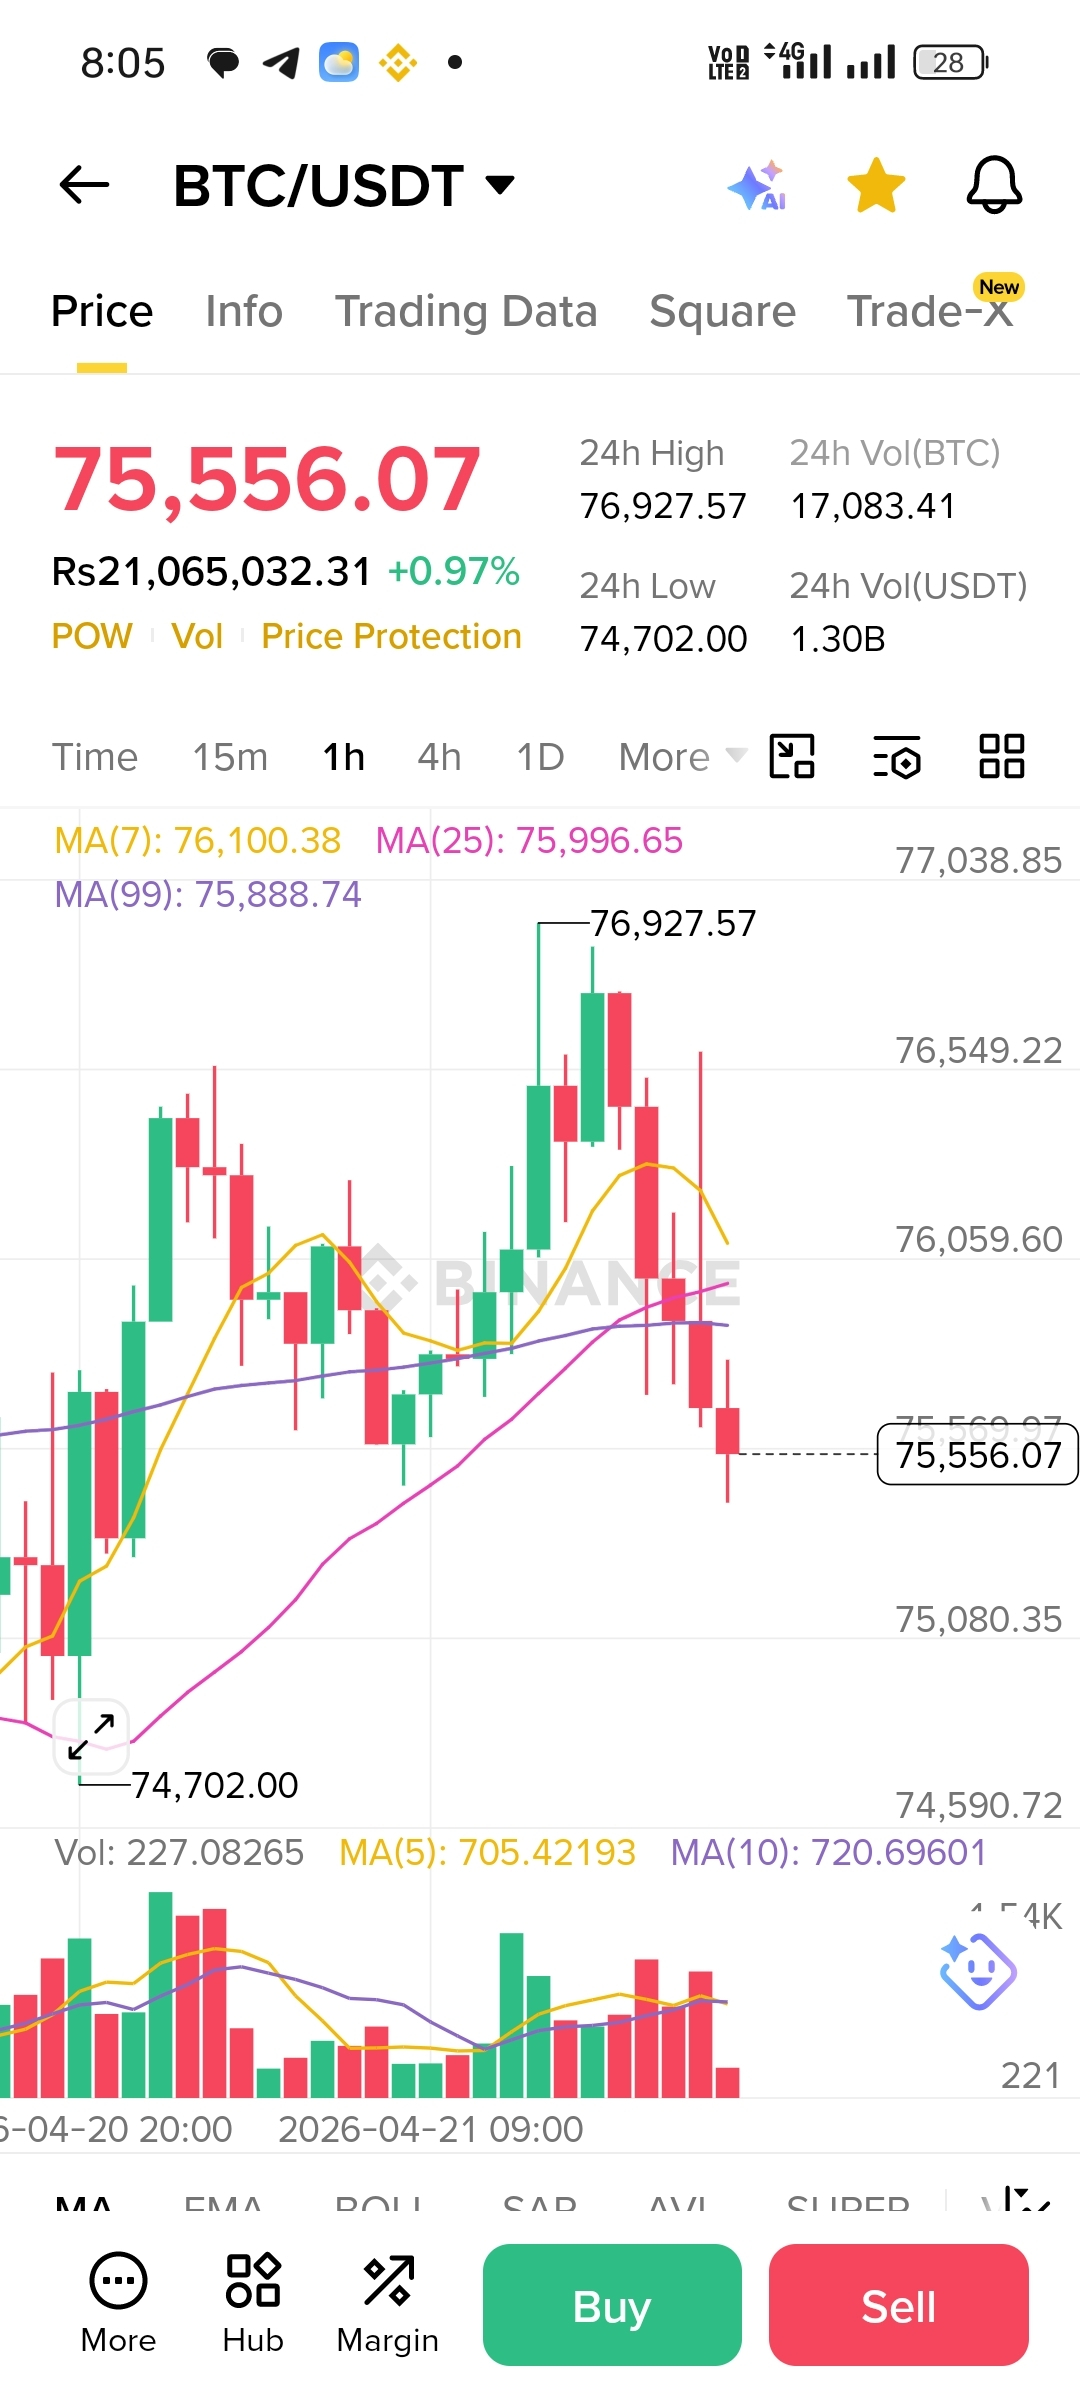
Bitcoin (BTC)$BTC is currently trading around $75,556, showing a mild +0.97% gain over the past 24 hours. Despite the positive daily change, the recent price action reflects short-term bearish pressure following a rejection near the $76,900 resistance zone.
🔍 Market Structure Overview
On the 1-hour timeframe, BTC formed a local high at $76,927, but failed to sustain momentum above this level. The rejection led to a series of lower highs and strong red candles, signaling that sellers are stepping in aggressively near resistance.
Price has now dropped below key short-term moving averages:
MA(7): 76,100
MA(25): 75,996
MA(99): 75,888
This positioning indicates a loss of bullish momentum in the immediate term.
📉 Volume & Momentum Insight
Volume shows a slight increase during the recent sell-off, suggesting active distribution rather than weak pullback. This raises the probability of further downside unless buyers regain control quickly.
Momentum indicators (price relative to MAs) suggest BTC is currently in a short-term correction phase.
📌 Key Levels to Watch
🔴 Resistance Zones:
$76,000 – $76,500 (MA cluster + previous support turned resistance)
$76,900 (recent high)
🟢 Support Zones:
$75,000 (psychological + intraday support)
$74,700 (24h low)
Below this, further downside could extend toward $74,000
⚡ What’s Next?
If BTC reclaims $76,000 with strong volume, we may see another attempt toward the $76.9K resistance.
Failure to hold above $75,000 could trigger further downside continuation, with sellers targeting lower liquidity zones.
🧠 Conclusion
The current structure leans short-term bearish, but the broader trend remains neutral unless major supports break. Traders should watch for confirmation signals before entering positions, as the market is currently in a decision zone.