Looking at your BTC/USDT 4H chart, here’s a clear breakdown of what’s happening and where price is likely heading:
📊 Current Structure
Price: ~77,600
Recent high: ~79,400
Market pulled back after a strong push up → short-term correction
Still trading above EMA(20) and well above EMA(50) & EMA(200) → overall trend is bullish
🔍 Indicators Analysis
1. Moving Averages (EMA)
EMA(20) ≈ 77,400 → price sitting right on it (key support)
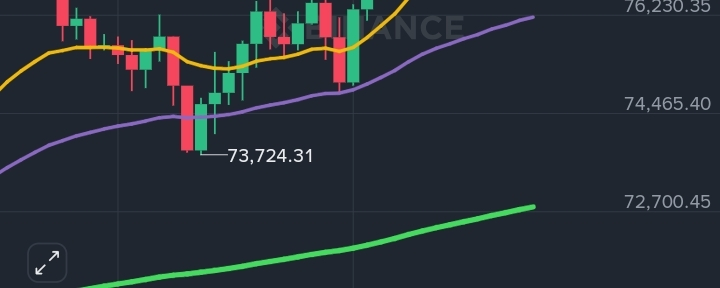
EMA(50) ≈ 76,100 → next strong support
EMA(200) ≈ 72,700 → major trend support
👉 Trend is still uptrend unless EMA20 breaks strongly
2. MACD
Histogram decreasing → momentum slowing
Still positive → bullish trend not broken yet
👉 Indicates pullback / consolidation, not full reversal
3. RSI
Around 56 → neutral-bullish
Not overbought → room to go up again
4. Stochastic (KDJ)
Turning down → short-term weakness
🔑 Key Levels
Support:
77,400 (EMA20) ⚠️ immediate
76,200 (EMA50)
73,700 (previous low)
Resistance:
78,600
79,400 (recent high)
80,000 psychological level
📈 Possible Scenarios
✅ Bullish Case (More Likely)
If price holds above 77,400
Bounce from EMA20 👉 Target:
78,600 → 79,400 → breakout to 80K+
⚠️ Bearish Case (Short-Term Pullback)
If price breaks below 77,400 👉 Then:
Drop to 76,200 (EMA50)
Possible deeper correction before next move up
🧠 Final View
Market is in uptrend but cooling off
This looks like a healthy pullback / consolidation
Not a reversal yet
💡 Simple Strategy Idea
Buy zone: near EMA20 / 77.4K
Stop loss: below 76K
Target: 79K–80K
If you want, I can �mark exact entry/exit points on your chart or �check lower timeframe (15m/1h) for precise trade setup.