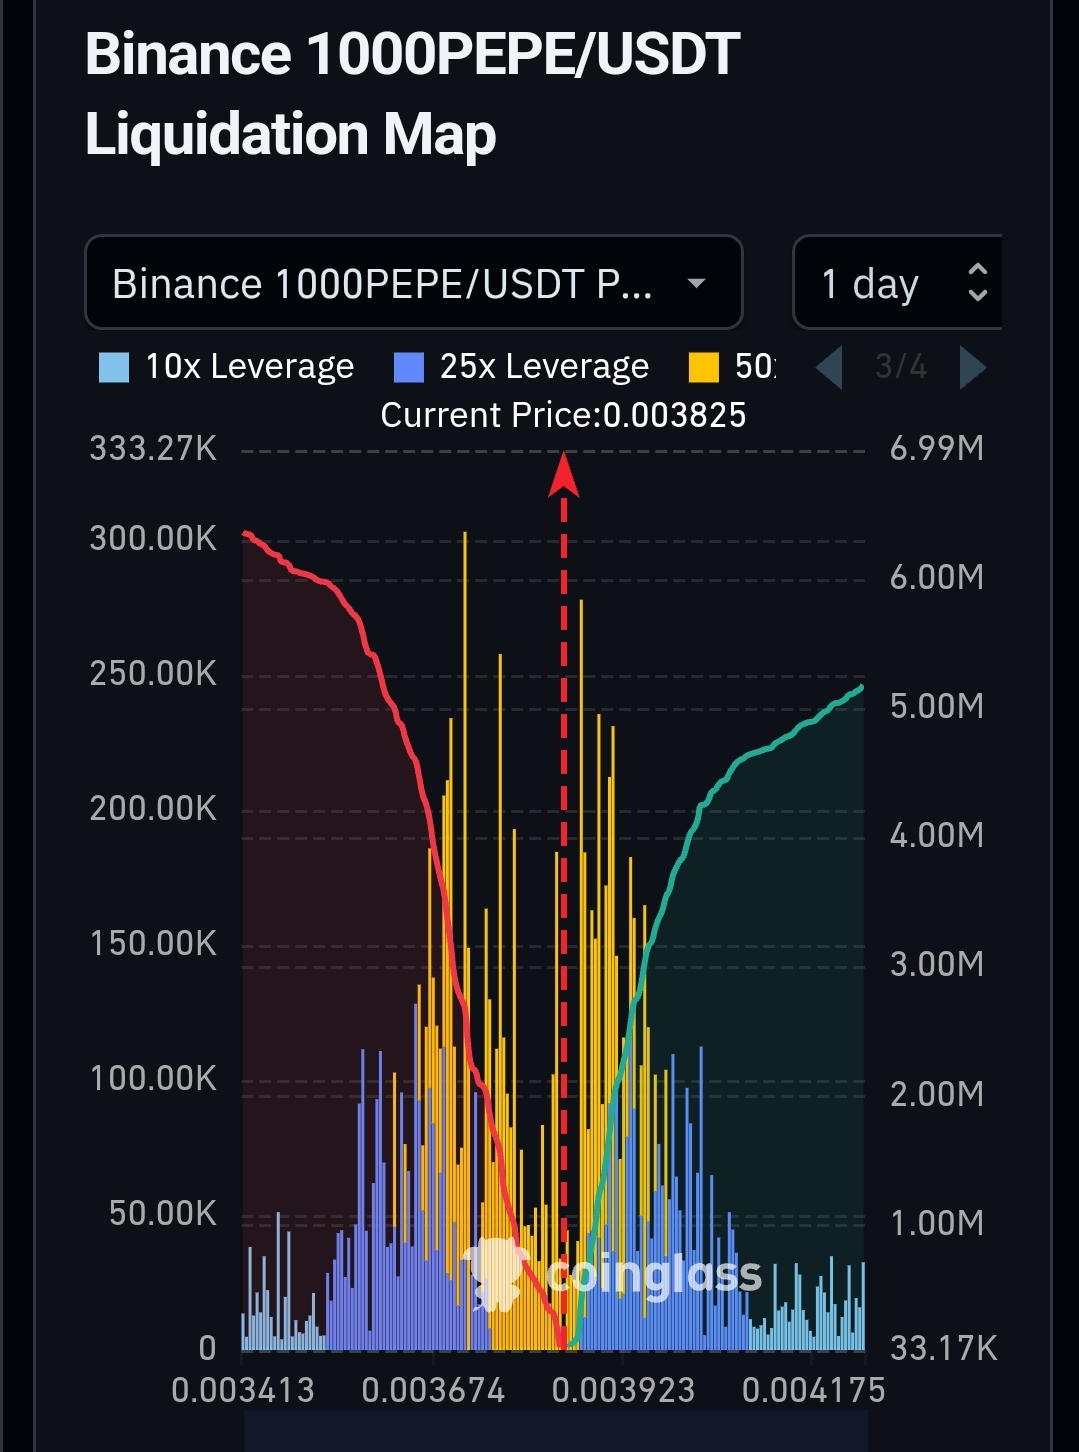
આ ચાર્ટ Binance 1000PEPE/USDT Liquidation Map છે, એટલે કે અહીં બતાવવામાં આવ્યું છે કે અલગ-અલગ leverage પર long/short traders ના liquidation clusters ક્યાં-ક્યાં છે. આ પ્રકારનો ચાર્ટ ભાવ ક્યાં “magnet” થઈ શકે છે, અને કયા લેવલ્સ પર stop-hunt અથવા sharp move આવી શકે છે, તેનો અંદાજ આપવા માટે ઉપયોગી હોય છે.
ચાર્ટમાં શું દેખાય છે
Current Price: 0.003825
હાલનો ભાવ લગભગ [0.003825] પર છે.નીચેની બાજુ price axis છે, લગભગ [0.003413] થી [0.004175] સુધી.બાજુએ અને વચ્ચેના vertical bars liquidation liquidity બતાવે છે.રંગો leverage buckets દર્શાવે છે:Light blue = [10\times] leverageBlue/Purple = [25\times] leverageYellow = higher leverage bucketRed curve બાજુમાં down-side liquidity/short liquidation pressure બતાવતી લાગે છે.Green curve ઉપરની બાજુ long liquidation pressure / liquidity buildup દર્શાવે છે.
મુખ્ય observation
આ ચાર્ટમાં ભાવના આજુબાજુ [0.0038]–[0.0039] પર ખૂબ મોટો liquidation concentration છે. ખાસ કરીને current priceની આસપાસ જ ભારે bars દેખાય છે, એટલે બજાર અહીં બહુ “sensitive” છે.
ઉપરની બાજુ શું સૂચવે છે
[0.003923] પછી અને ખાસ કરીને [0.0040] થી ઉપર લીલા side પર liquidity વધતી દેખાય છે. તેનો અર્થ:જો ભાવ ઉપર જાય, તો shorts squeeze થઈ શકે.ભાવ આ લેવલ્સને ખેંચવા માટે “magnetic pull” અનુભવી શકે છે, કારણ કે ત્યાં ઘણાં liquidation orders છે.ઉપરના clusters ખાસ કરીને resistance + liquidity target તરીકે કામ કરી શકે.
નીચેની બાજુ શું સૂચવે છે
[0.003764] થી નીચે અને ખાસ કરીને [0.00367] તરફ પણ clusters દેખાય છે. તેનો અર્થ:
જો ભાવ નીચે સરકે, તો long liquidation cascade આવી શકે.
નીચે liquidity હોવાથી price ત્યાં સુધી “wick” મારી શકે છે, especially volatility વધારે હોય ત્યારે.
lower levels often act as support zones but also liquidation pools.Yellow spikes નો અર્થ
Yellow bars સૌથી ઊંચી leverage zone બતાવે છે, એટલે:અહીં traders સૌથી વધુ vulnerable છે.જો ભાવ આ zone ને touch કરે, તો ઝડપથી liquidation trigger થઈ શકે.High leverage cluster હોય ત્યાં સામાન્ય રીતે price fast move કરે છે.એકંદર ભાવ-વ્યવહારની શક્યતાઆ map પરથી ત્રણ મુખ્ય scenarios લાગે છે:
Upside squeeze scenario
જો buyers momentum આપે, તો ભાવ [0.003923] પાર કરીને [0.0040] અને આગળ liquidity pocket તરફ દોડી શકે.
Downside sweep scenario
જો market weak પડે, તો ભાવ [0.00376] અથવા [0.00367] સુધી જઈને longsને flush કરી શકે.Range trap scenario
ભાવ હાલના area [0.00382]–[0.00392] વચ્ચે chop કરી શકે છે, જેથી બંને side ના traders trap થાય અને પછી એક તીવ્ર breakout આવે.આ ચાર્ટને કેવી રીતે વાંચવો
Liquidation map ને સીધો prediction chart નહીં, પણ probability + liquidity map તરીકે વાંચવો જોઈએ:જ્યાં cluster વધુ હોય ત્યાં ભાવને attract કરવાની સંભાવના રહે છે.પણ price હંમેશા એ જ દિશામાં જશે જ એવું નથી; કોઈ પણ news, BTC move, અથવા sudden whale order pattern બદલી શકે છે.1000PEPE જેવી meme coinમાં આ effect વધુ તીવ્ર હોય છે, કારણ કે volatility વધારે હોય છે.સરળ ઉદાહરણધારો ભાવ [0.003825] પર છે અને ઉપર [0.003923] પાસે મોટો liquidation cluster છે. તો market makers અથવા aggressive traders price ને ઉપર push કરીને shorts squeeze trigger કરી શકે. એ પછી price થોડું spike થઈને પાછું પણ આવી શકે.Practical takeawayImmediate zone: [0.00382]–[0.00392]Upside liquidity target: [0.00393]–[0.00405]Downside liquidity target: [0.00376]–[0.00367]Risk: high volatility, fakeouts, wick-based liquidation hunts.
Disclaimer: don't agree with me do your investment at your own research and risk.