We're now seeing a pattern in candlestick analysis — and recognizing patterns within the patterns is what makes you dangerous as a trader.
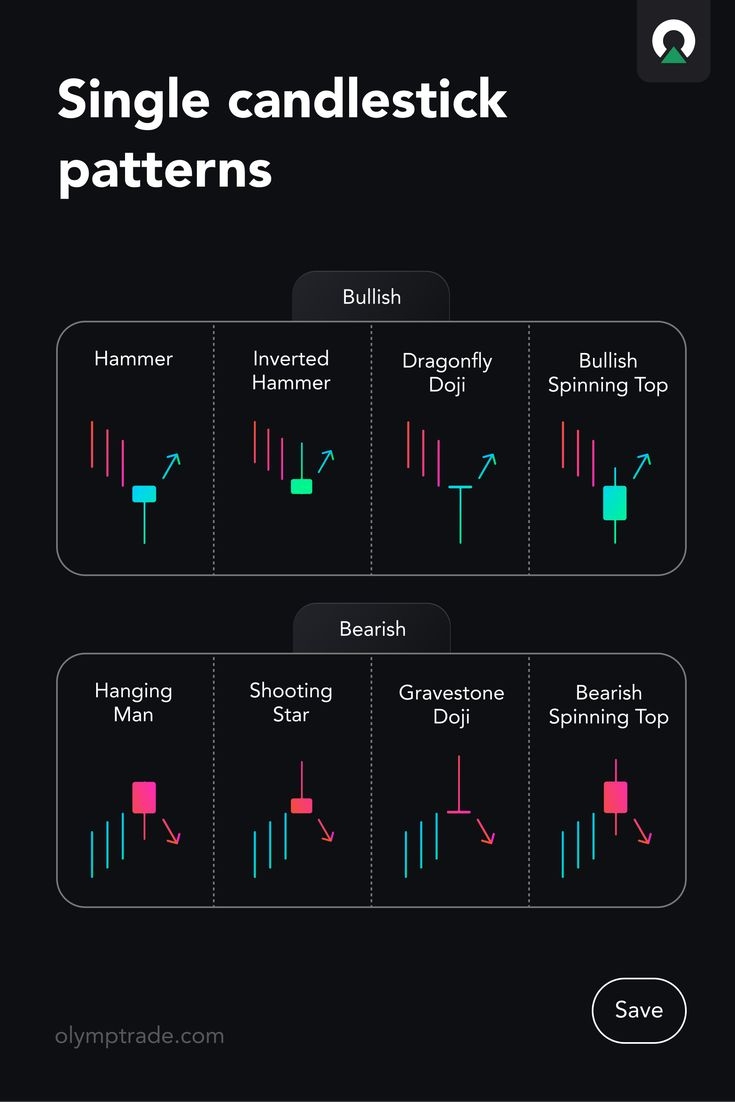
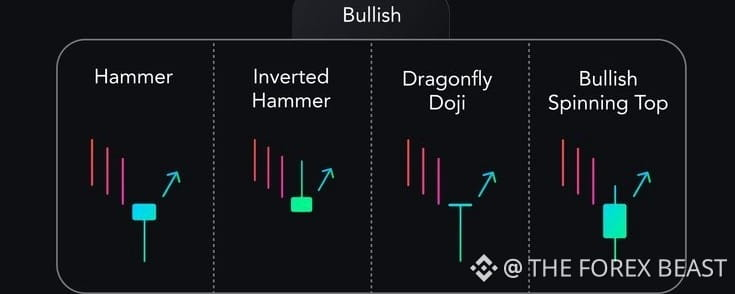
Just like the Hammer and Hanging Man were mirror images in terms of location meaning, the Shooting Star and Inverted Hammer are mirror images in terms of shape.
THE SHOOTING STAR ⭐
Code
Characteristics:
Small body at the BOTTOM of the candle
Very long upper wick
Little to no lower wick
Appears at the TOP of an uptrend or at resistance
The story:
Buyers pushed price aggressively upward during the period — sometimes making new highs. But sellers came in with overwhelming force and pushed price all the way back down, closing near the open.
The buyers tried to take price higher. The sellers completely destroyed that attempt.
Signal: Bearish reversal. The uptrend may be ending.
Real Example:
EUR/USD has been rising. It approaches a major resistance at 1.1200 — a level that has rejected price before. A Shooting Star forms right at 1.1200, with the wick extending to 1.1230 before closing back at 1.1195.
This tells you: buyers tried to break 1.1200. Sellers rejected them hard. A fall is likely coming.
Enter SHORT after the next bearish confirmation candle. Stop loss above the Shooting Star's high (1.1230). Target the next support below.
THE INVERTED HAMMER 🔨 (upside down)
Code
Wait — this looks IDENTICAL to the Shooting Star!
Yes. Again, same shape. Different location. Different meaning.
The Inverted Hammer appears at the BOTTOM of a downtrend.
The story:
The market has been falling. During this period, buyers tried to push price up aggressively — creating that long upper wick. Sellers pushed it back down. BUT — and this is crucial — the fact that buyers had enough energy to push price that far UP in the middle of a downtrend shows that buying pressure is building.
It may not look like a bullish candle at first glance. But in context, it signals potential reversal upward.
Confirmation is even MORE important here because this is a weaker signal than a standard Hammer. You must wait for the next candle to confirm buyers are taking control.
Summary Table:
Pattern
Shape
Location
Signal
Hammer
Small body top, long lower wick
Bottom of downtrend
Bullish reversal
Hanging Man
Small body top, long lower wick
Top of uptrend
Bearish reversal
Shooting Star
Small body bottom, long upper wick
Top of uptrend
Bearish reversal
Inverted Hammer
Small body bottom, long upper wick
Bottom of downtrend
Bullish reversal
The Master Principle:
Long lower wick = buyers rejecting lower prices = bullish pressure
Long upper wick = sellers rejecting higher prices = bearish pressure
But the TREND CONTEXT determines whether that pressure is a reversal or continuation signal.
Burn this into your mind. It will serve you for your entire trading career.