Three cycles. Six years. One pattern that keeps working.
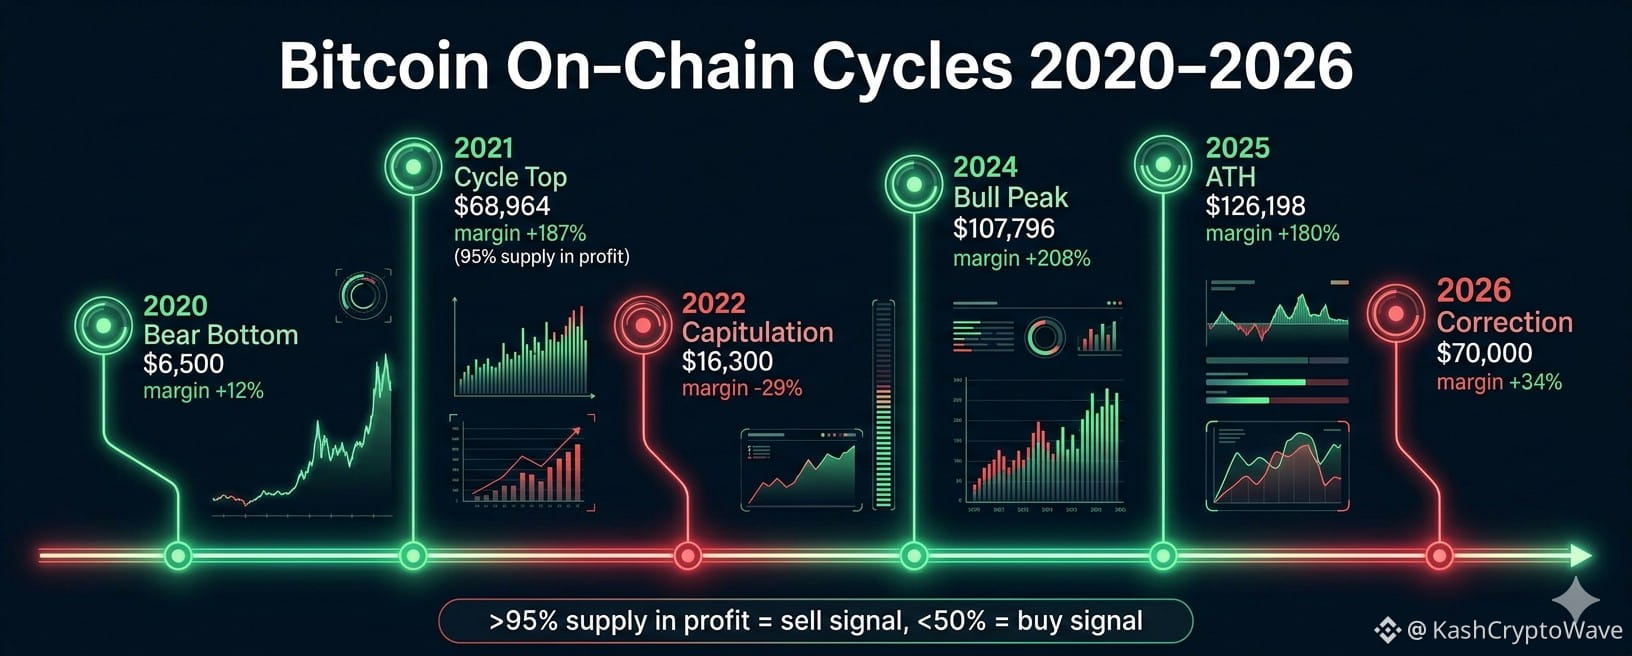
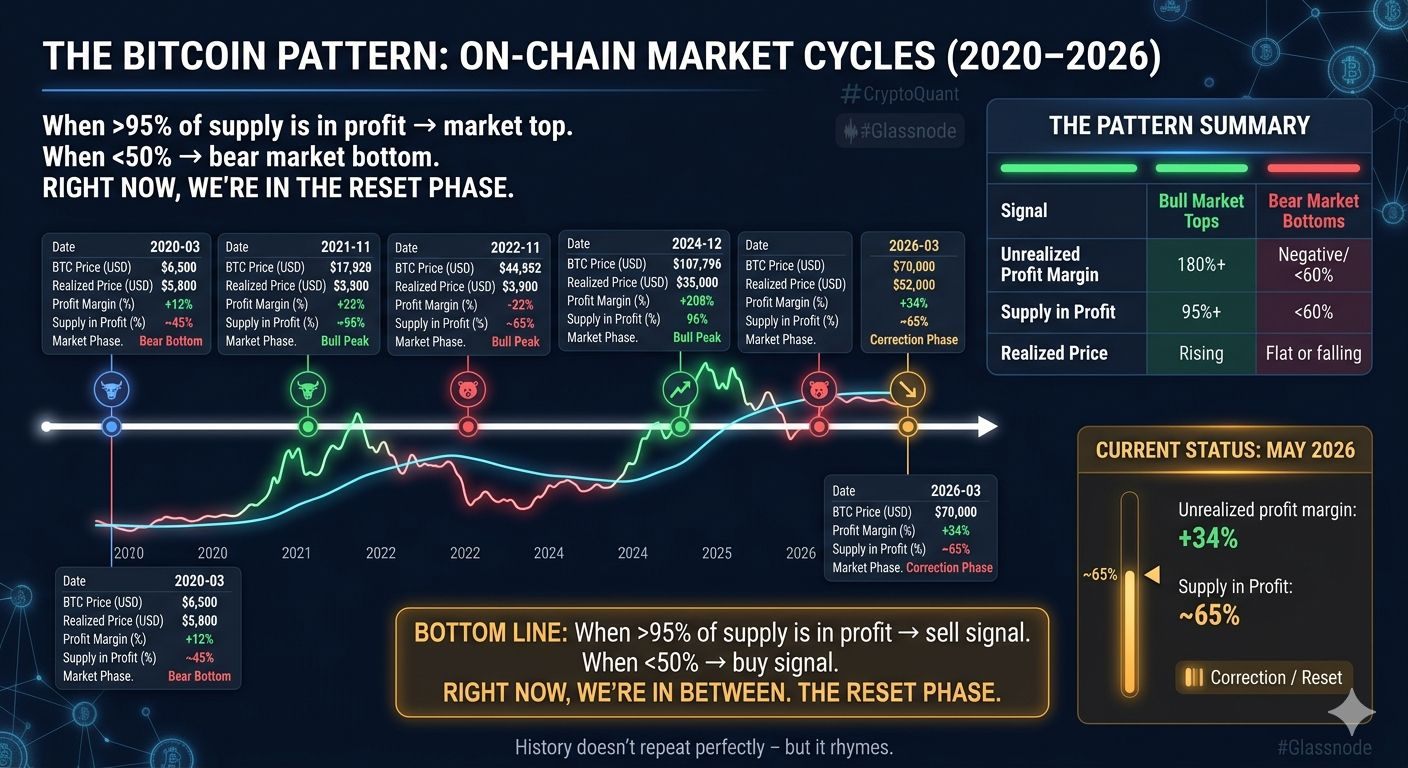
The pattern is clear: When >95% of supply is in profit → market top. When <50% → bear market bottom. Right now, we're in the reset phase.
Full Data Table (2020–2026)
Date BTC Price (USD) Realized Price (USD) Unrealized Profit Margin (%) Supply in Profit (%) Market Phase
2020-03 $6,500 $5,800 +12% ~45% Bear bottom
2020-12 $28,989 $7,500 +286% 95% Bull start
2021-04 $64,000 $17,000 +276% 97% Euphoria
2021-11 $68,964 $24,000 +187% ~95% Cycle top
2022-06 $20,000 $22,000 -9% ~40% Capitulation
2022-11 $16,300 $23,000 -29% ~25% Bear bottom
2023-12 $40,000 $25,000 +60% ~70% Recovery
2024-12 $107,796 $35,000 +208% 96% Bull peak
2025-10 $126,198 $45,000 +180% ~94% All-time high
2026-03 $70,000 $52,000 +34% ~65% Correction
Visual Timeline
2020-03 2021-11 2022-11 2024-12 2025-10 2026-03
● ● ● ● ● ●
│ │ │ │ │ │
$6,500 $68,964 $16,300 $107,796 $126,198 $70,000
Realized Realized Realized Realized Realized Realized
$5,800 $24,000 $23,000 $35,000 $45,000 $52,000
Margin Margin Margin Margin Margin Margin
+12% +187% -29% +208% +180% +34%
Bear Cycle Capit- Bull All-Time Correction
Bottom Top ulation Peak High Phase
The Pattern
Signal Bull Market Tops Bear Market Bottoms
Unrealized Profit Margin 180% (2021, 2024, 2025) Negative (2022) or <60%
Supply in Profit 95% <50%
Realized Price Rising (cost basis increases) Flat or falling
Current status (May 2026):
· Unrealized profit margin: +34%
· Supply in profit: ~65%
· Market phase: Correction / Reset
Bottom Line
When >95% of supply is in profit → sell signal.
When <50% → buy signal.
Right now, we're in between. The reset phase.
History doesn't repeat perfectly – but it rhymes.