$OSMO Here is the latest Osmo (OSMO) analysis based on the current market dynamics, featuring a specialized technical chart.
Osmo (OSMO) Latest Analysis: Consolidation Zone Holds Key to Next Leg
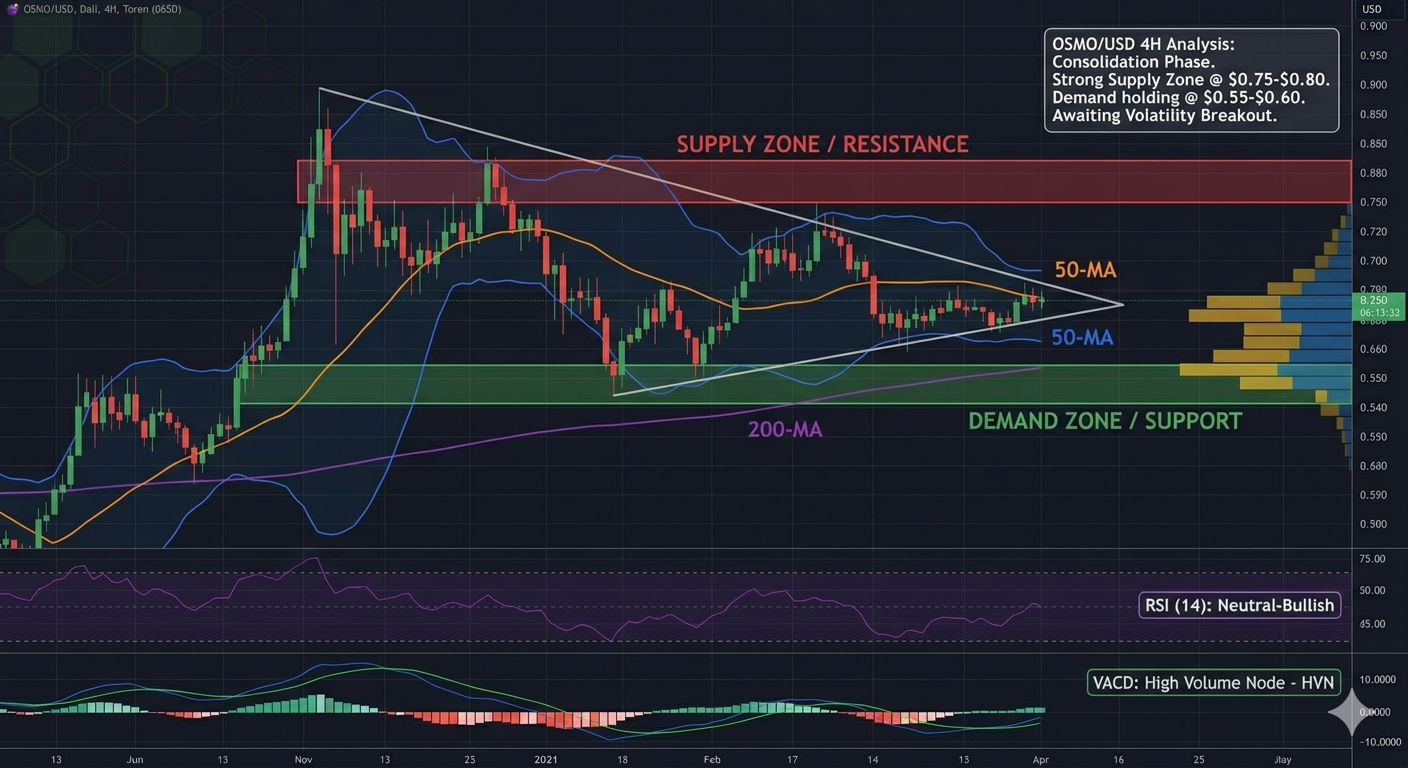
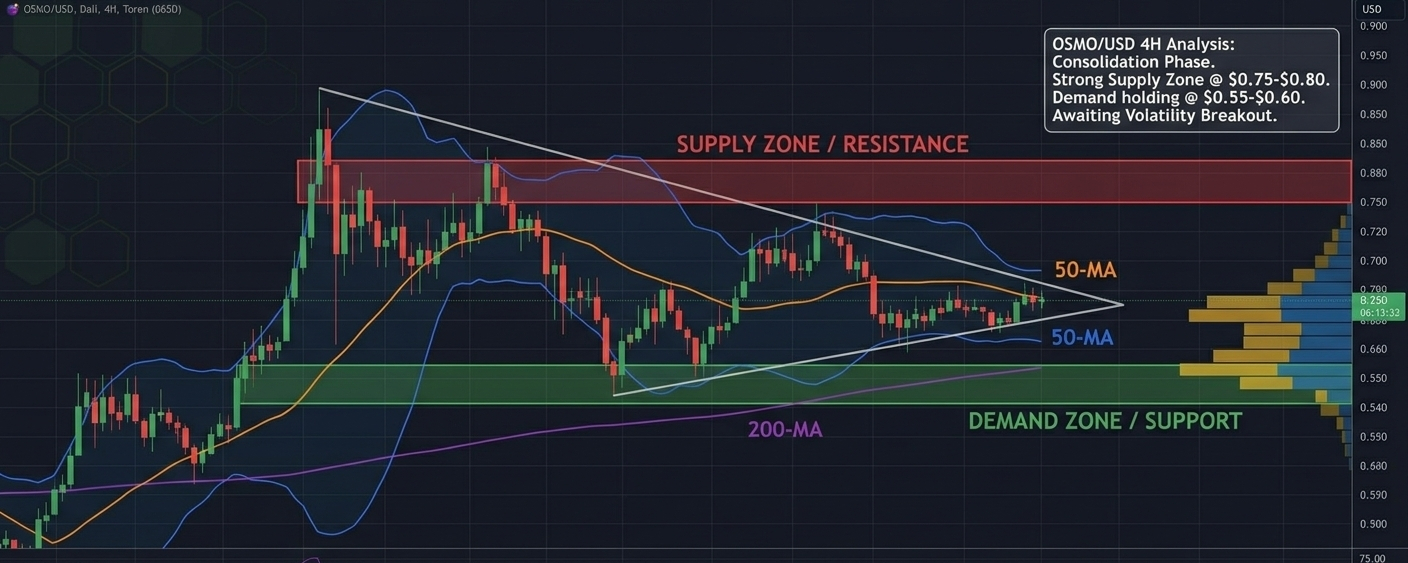
Osmosis (OSMO) is currently navigating a period of tight consolidation, forming a potential base after experiencing significant volatility earlier in the year. The chart provided highlights the key technical battlegrounds that will define OSMO's direction in the coming weekOSMO/USD Technical Landscape (4-Hour Chart)
The OSMO chart is locked in a classic consolidation structure. Here is the breakdown:
1. Key Zones and Structure
Supply Zone / Resistance (Red Box: $0.75 - $0.80): This overhead supply zone is the main barrier. OSMO has repeatedly rejected this area, establishing it as major resistance.
Demand Zone / Support (Green Box: $0.55 - $0.60): Conversely, the $0.55-$0.60 region is acting as crucial support. Strong buying interest has materialised here during pullbacks, forming a firm floor.
Symmetric Triangle: The price action is compressing inside a symmetric triangle pattern (converging blue trendlines), indicating that a significant volatility breakout is imminent.
2. Indicators and Momentum
Moving Averages: OSMO is trading below both the flattening 50-MA (orange) and 200-MA (purple) on the 4H timeframe, suggesting a short-term bearish bias despite the consolidation.
RSI (14): The RSI is oscillating near the 40 mark, reflecting neutral to weak momentum. It is neither overbought nor oversold, mirroring the broader market's uncertainty.
Bollinger Bands: The bands are tightening (the blue outer lines), a classic precursor to increased volatility. A sharp move is likely once the price breaches one of the converging triangle trendlines.
Outlook and Key Scenarios
The current technical setup suggests that the immediate trend will be defined by which zone breaks first:
Bullish Breakout: A decisive close above the upper triangle trendline and a successful retest of the $0.75 - $0.80 Supply Zone would signal a major bullish reversal, potentially targeting $1.00 or higher.
Bearish Breakdown: A failure of the lower triangle trendline and a drop into the $0.55 - $0.60 Demand Zone would confirm bearish dominance. Losing this support floor could lead to a deeper correction toward $0.45.
Traders are likely waiting for a confirmation (higher high or lower low) outside the symmetric triangle before committing to the next major direction. Trade carefully and utilize appropriate stop-losses.s.#OSMO/USDT #THORChainHackCauses$10.7MLoss #BitcoinETFsSee$131MNetInflows #DuneCuts25%AmidAIEfficiencyPush #TrumpDisclosesTradesIncludingMARAStock