
Three independent on-chain data sources published this week are measuring the current Bitcoin correction from different angles and reaching the same conclusion, and the conclusion has a structural explanation that none of them states alone.
Key Takeaways
BTC relative unrealized loss at approximately 0.2: lowest reading in Bitcoin's history.
If $60,000 holds as cycle low, shallowest bear market ever.
STH whale P&L approaching breakeven: shift from selling to holding possible.
Adjusted MVRV remains in Bull zone.
What the relative unrealized loss chart shows
Glassnode's BTC Relative Unrealized Loss chart that spans 2014 to 2026 and places the current correction in full historical context. The orange area representing relative unrealized loss peaked at approximately 1.2 during the 2015 bear market, approximately 0.7 during the 2018–2019 cycle, and approximately 0.5 during the 2022 bear. The current reading sits at approximately 0.2, the lowest peak loss depth recorded across any comparable correction period in Bitcoin's history.
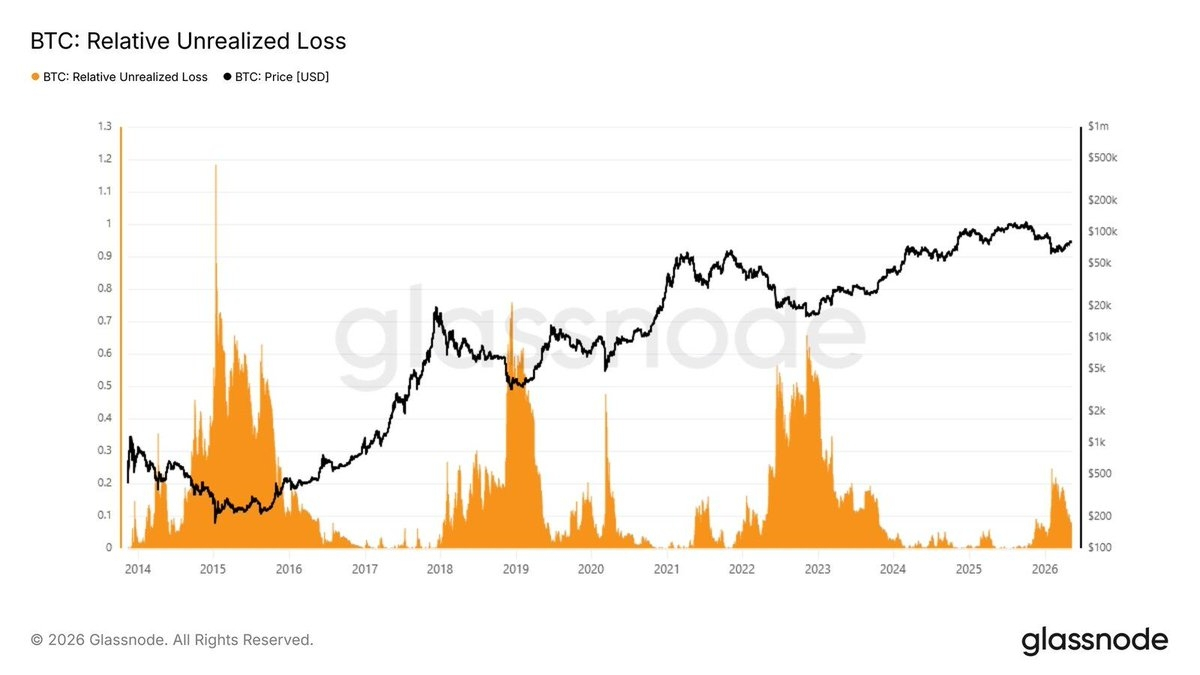
According to the chart if $60,000 holds as Bitcoin's cycle low, this would be the shallowest bear market in Bitcoinhistory. The relative unrealized loss reading of approximately 0.2 is not just lower than prior bear markets: it is lower than the readings Bitcoin produced during most of its sideways consolidation periods, which means the current correction has inflicted less aggregate loss on the network than periods that were not even classified as bear markets in prior cycles.
What the STH whale P&L chart adds
The second data point comes from Glassnode's Short-Term Holders Whale Unrealized Profit and Loss chart, analyzed by MorenoDV_ via CryptoQuant. The chart shows the STH whale cohort moved into significant unrealized loss territory from November 2025 onward as price declined, with the aggregate loss reading reaching approximately -$8 billion at its deepest point. The SMA30 of that metric is now visible recovering upward at the chart's right edge, approaching zero from below.
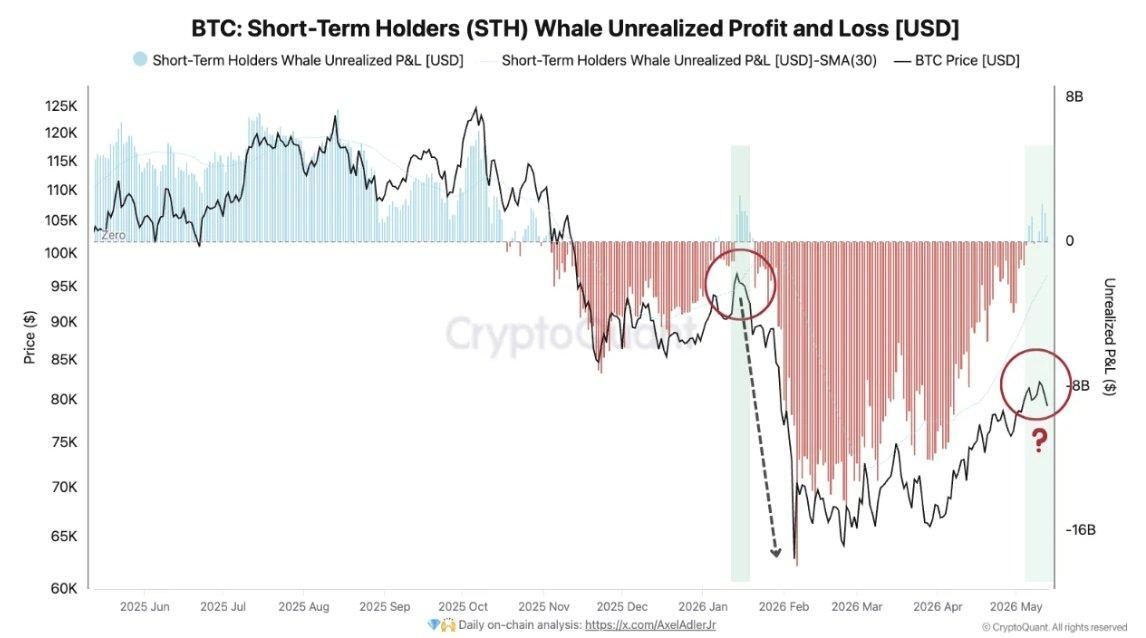
Glassnode's interpretation, as reported, is that if Bitcoin stabilizes above the STH whale cost basis, this cohort could shift from defensive selling back to passive holding. The chart annotates a question mark at the current juncture, referencing an earlier February 2026 episode where the SMA30 briefly approached zero before price declined again.
The question the STH whale P&L chart poses with its question mark annotation is precise: whether the current approach to breakeven produces a behavioral shift from defensive selling to passive holding, as Glassnode describes, or whether whales use the return to breakeven as a distribution opportunity, which is the same fork in the road the market faced at the February 2026 circled area before price declined again. The February episode resolved bearishly. Whether the current episode resolves differently is the open question the chart cannot answer.
What the realized P&L ratio and MVRV confirm
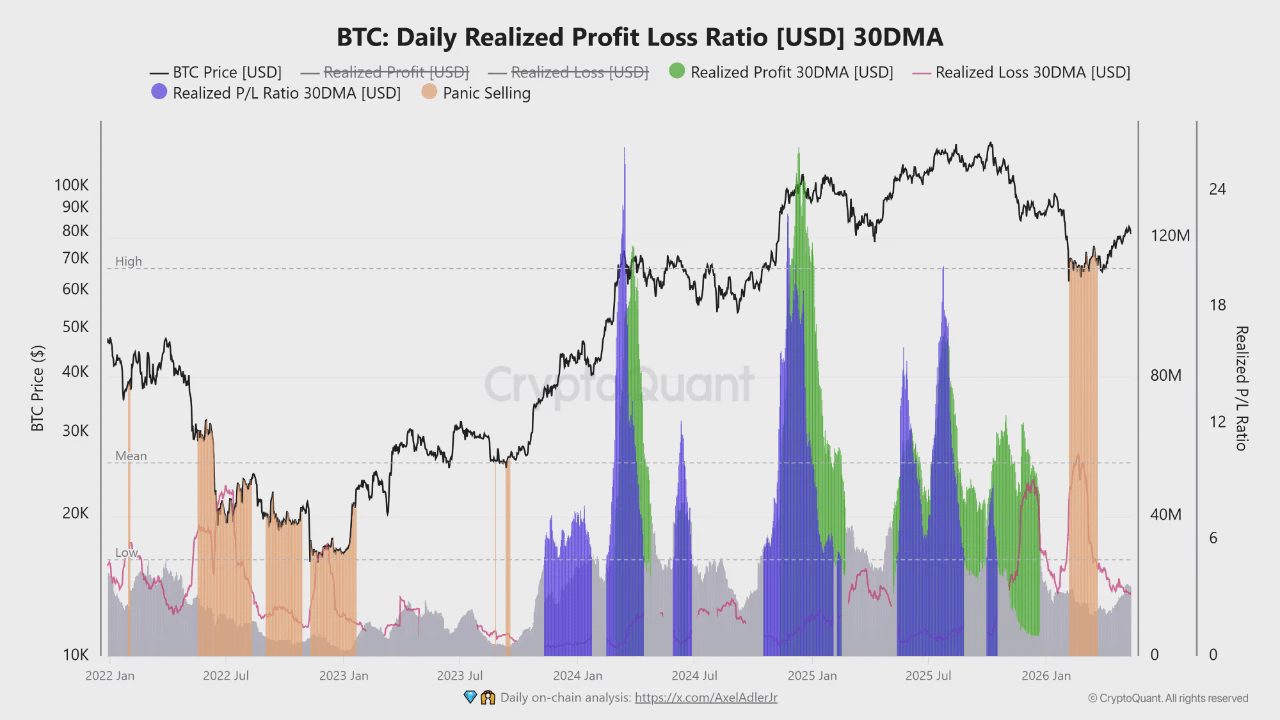
CryptoZeno's analysis via CryptoQuant adds two further data points. The Daily Realized Profit/Loss Ratio 30DMA has declined significantly from the elevated readings of the 2025 peak, signaling that aggressive profit-taking pressure has faded. The recent realized-loss spike visible on the chart represents localized panic selling rather than a macro reversal: historically, CryptoZeno notes, loss-expansion phases of this type appear during corrective resets inside broader bull cycles rather than at the start of structural bear markets.
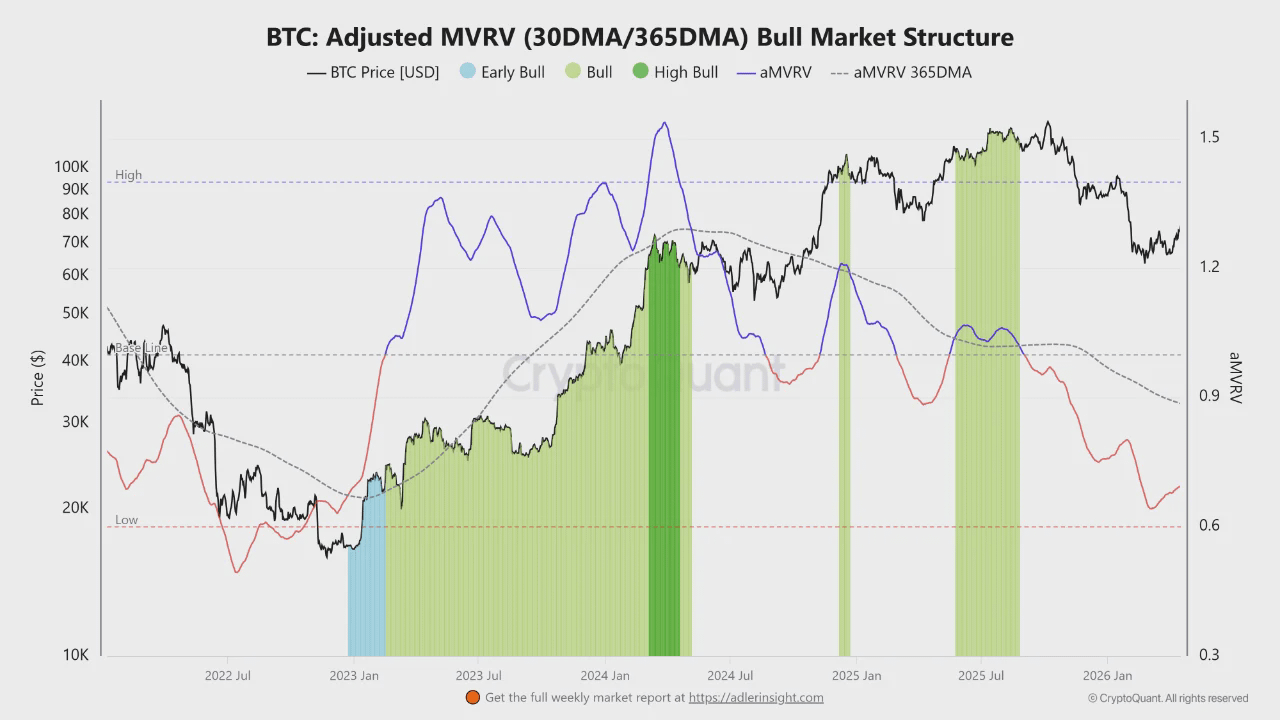
The Adjusted MVRV, measured as the 30DMA versus 365DMA ratio, has retraced from overheated conditions but remains in the light green Bull zone rather than declining into the bear-market transition territory seen at prior cycle tops. Prior cycle top collapses were accompanied by sustained MVRV deterioration into structurally weak territory. The current reading resembles what CryptoZeno describes as mid-cycle normalization: valuation excess cleared without fully compromising the bullish market structure.
Why all three point to the same structural explanation
Three frameworks arriving at the same conclusion simultaneously - shallowest relative loss in history, MVRV remaining in bull territory, and STH whales approaching their cost basis from below - is not coincidence: it is the structural consequence of a realized value base that has risen high enough that the usual depth of loss is no longer achievable without a price decline that the current holder base has not produced.
The structural explanation the data points toward is that Bitcoin's realized value, the aggregate cost basis of all coins in circulation, has risen substantially through the 2023–2025 accumulation cycles. A higher realized value base means a correction must go deeper in absolute price terms to produce the same relative loss depth as prior cycles. The current correction has not gone that deep.
On the other hand a shallow loss reading is not a guarantee of recovery. It is a description of where the market is, not a prediction of where it goes. The STH whale question mark, the MVRV remaining in bull territory rather than confirming a breakout, and CryptoZeno's note that the market is recalibrating leverage before the next directional move all describe a market in a holding pattern whose direction is determined by whether stabilization above whale cost basis produces passive holding or one final distribution event.
A sustained daily close above $85,000, with the STH whale P&L SMA30 crossing above zero and MVRV moving into the dark green high-bull zone, would confirm the three frameworks are jointly signaling a resumption of the bull cycle rather than a temporary pause within a deeper correction.
A decline below $70,000, pushing the relative unrealized loss reading above 0.35, a level that would approach the lower range of prior corrective cycles, with the STH whale P&L back toward -$8 billion, would indicate the shallowest-ever correction framing has broken down and the structural realized-value floor argument requires reassessment at lower price levels.