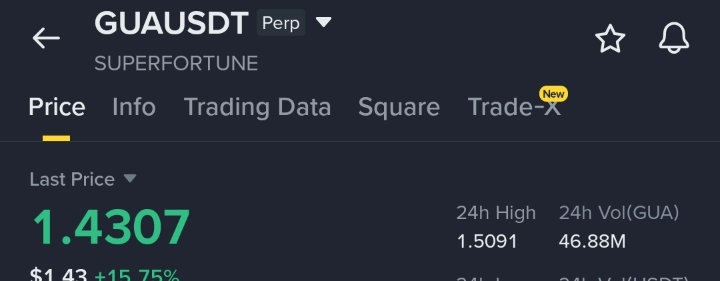
Looking at the $GUA perpetual chart right now, things are getting incredibly interesting! GUA is currently trading at $1.4307, up a massive +15.75% over the last 24 hours.
If we look at the macro perspective, the asset is on an absolute tear:
Today: +10.87%
7 Days: +51.28%
30 Days: +146.71%
90 Days: +902.24% 🤯
🔍 Technical Breakdown
While the long-term trend is aggressively bullish, the short-term line chart shows some immediate volatility:
The Dip and Recovery: We saw a sharp, sudden drop down to the $1.4027 level, which was quickly bought back up to $1.4307. This shows strong buying interest and support near the $1.40 psychological mark.
Moving Average Resistance: The price is currently fighting just below the MA60 (grey line) at 1.4425. A clean break and close above this MA on the lower timeframes could trigger the next leg up toward the 24h high of $1.5091.
Volume Spike: Notice that massive red volume bar during the dip? A lot of stop-losses were likely hunted there, but the immediate green volume follow-up indicates bulls are defending this zone.
💡 What's your move?
Are you holding bags from the lower levels, or are you looking to scalp this volatility? Be careful with leverage on perps right now—volatility is high!
👇 Drop your targets below! Is $1.60 next, or are we heading back to retest the $1.35 support?
#GUA #CryptoTrading #TechnicalAnalysis #BinanceSquare #GUAUSDT
