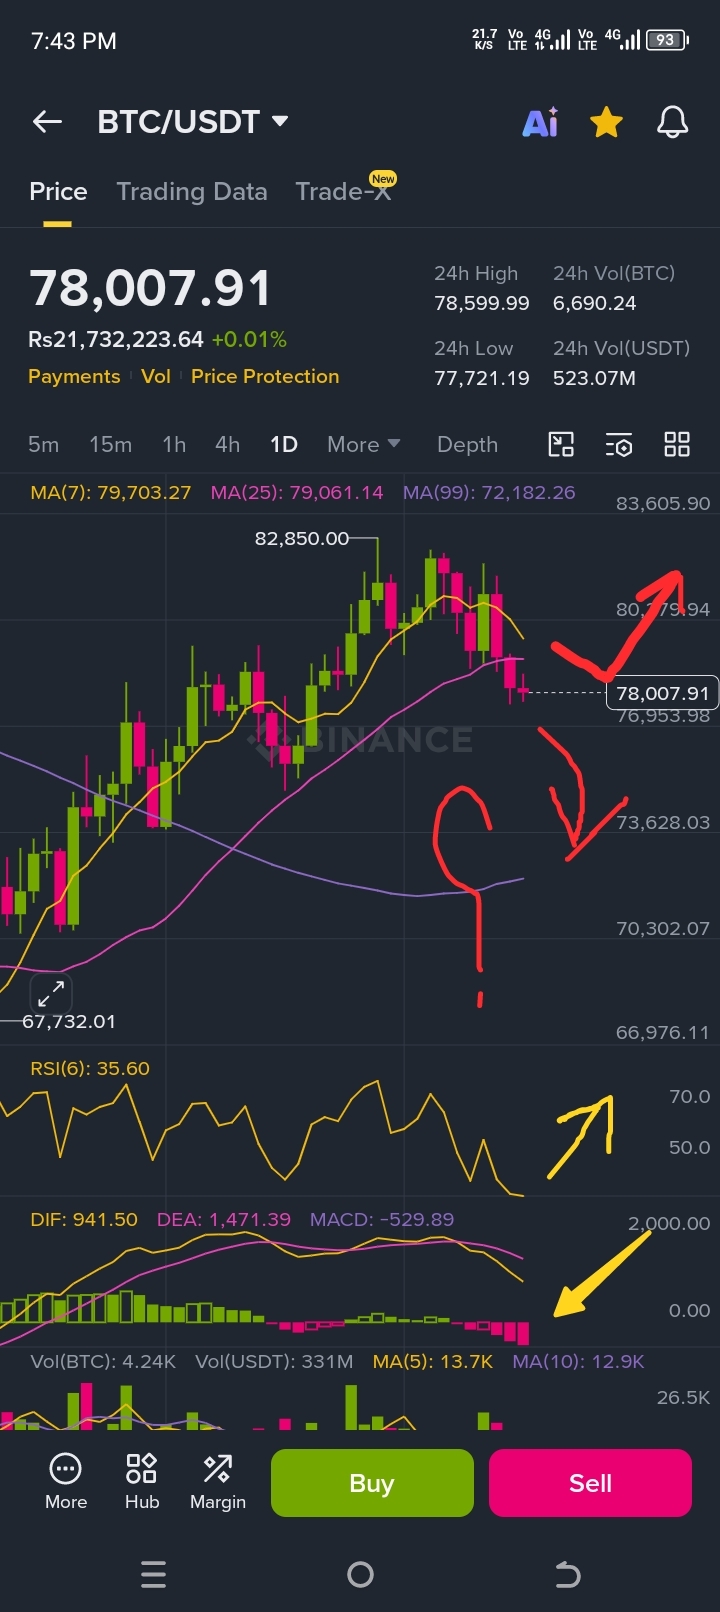
Current Status: The market is currently trading at 78,007.91. Red (Bearish) candles have been forming on the chart for a few consecutive days after hitting a recent high of $82,850.
Crossover Risk: Most importantly, the candles are currently below both the MA(7) (yellow line: 79,703) and MA(25) (pink line: 79,061). This indicates that there is a lot of pressure from sellers in the short term. If the candle closes below both these lines, the pressure on the market will continue.
2. RSI(6) Status (first yellow arrow)
Current Value: The RSI is currently at 35.60.
Analysis: It has reached quite close to the oversold zone (30). The yellow arrow you have drawn upwards is absolutely correct; because when the RSI drops this low, a bounce back or temporary recovery is expected from there. But remember that the RSI must turn for the recovery to begin.
3. MACD and Volume (Second Yellow Arrow)
Histogram: As you have indicated with the yellow arrow, the red bars on the histogram are getting bigger downwards, which shows that the bearish momentum is still strong.
Lines: The DIF and DEA lines are going downwards and their distance is increasing, which does not immediately indicate the start of a major uptrend, but rather requires caution for now.
Possible scenarios for the next two days (tomorrow and the day after)
The market will decide between the two levels you have drawn (the tick mark above and the arrow with the question mark below):
Scenario A: Downward support (question mark zone)
If the market cannot stop the current pressure, then below we have the MA(99) (purple line: 72,182) as a very strong long-term support. The market could make a wick from 73,600 to the 72,200 zone or come down to find support from there. This is where buyers can become active again.
Scenario B: Upward pullback (tick mark zone)
Since the RSI has fallen significantly, a "dead cat bounce" or small recovery can be expected from here. But for the market to become fully bullish again, it will have to close the candle above 79,100 and then 79,700 (MA 7 and 25). If this happens, the market will move back towards 80,700+.
Ustadji's advice (Trading Strategy)
Avoid immediate entry: Since the momentum on the 1D chart is still down, do not rush to take a big "buy" entry immediately.
Wait for confirmation: Either let the RSI turn up with support near 30, or let the price close above the moving average lines (79,100) again.
Strong buying zone: If the market falls further, the zone of 72,200 - 73,500 can be an excellent and safe support area for spot buying or long positions (with stop loss).
#THORChainHackCauses$10.7MLoss