
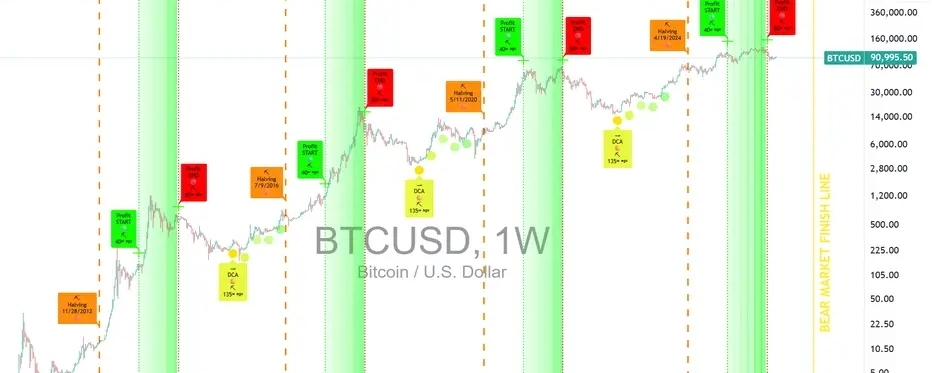
$Bitcoin $BTC is once again entering a highly important phase in the market. After experiencing strong volatility over the past few weeks, BTC is now trading around $77,700 on the 4H timeframe according to the chart shared above. Traders across the market are now asking the same question:
👉 Is BTC preparing for another bullish breakout, or is this just a temporary recovery before another correction?
In this detailed market update, we’ll analyze:
✅ Previous BTC moves
✅ Current trend structure
✅ Major support & resistance zones
✅ Demand & supply areas
✅ Volume behavior
✅ Moving averages
✅ Market psychology
✅ Possible next move scenarios
✅ Bullish & bearish outlook
✅ Smart trading strategies
Let’s dive deep into the Bitcoin market structure. 🚀
---
📈 Previous BTC Market Move
Over the last few weeks, Bitcoin experienced a sharp correction from the $82,000+ region toward the $76,000 demand zone.
🔻 What caused the correction?
Several factors likely contributed:
Profit-taking after strong bullish momentum 📉
Macro uncertainty 🌍
High leverage liquidation events ⚠️
Cooling institutional momentum 🏦
Traders reducing risk exposure
The chart clearly shows:
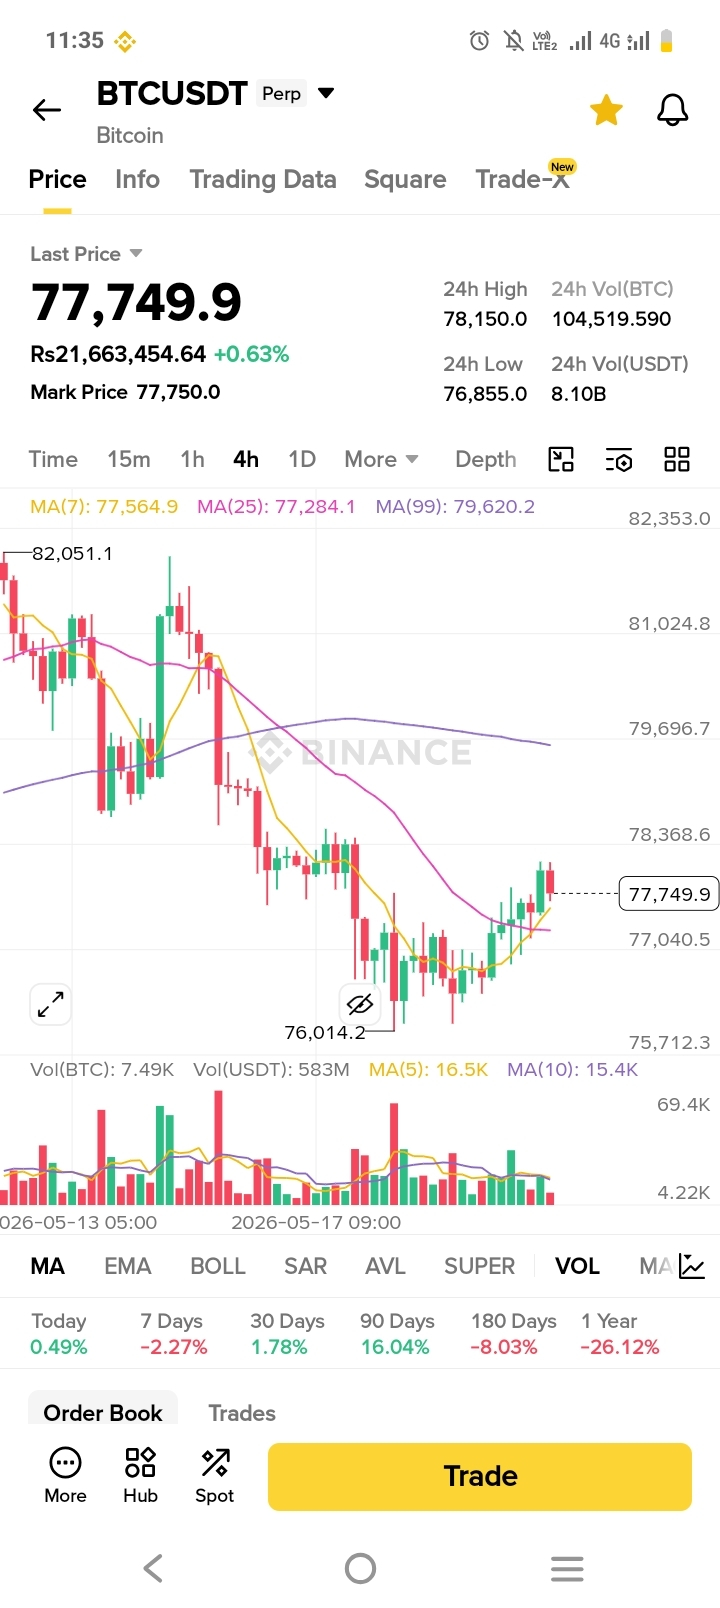
✅ BTC previously attempted to hold above $80K
❌ Sellers gained control near the upper resistance zone
❌ Price started forming lower highs
❌ Momentum weakened gradually
Eventually BTC dropped aggressively toward:
🟢 Major Demand Zone: $76,000 – $76,300
This area became extremely important because:
Buyers entered aggressively 💰
Long wicks appeared on candles 📍
Selling pressure slowed significantly
Recovery candles started forming
That tells us institutions and larger buyers likely defended this zone.
---
📊 Current Market Structure
At the moment BTC is trading around:
💲 Current Price: $77,749
On the 4H chart:
MA(7): 77,564
MA(25): 77,284
MA(99): 79,620
Important Observation 👀
BTC recently reclaimed short-term moving averages:
✅ Price above MA7
✅ Price above MA25
❌ Still below MA99
This suggests:
Short-term momentum improving 📈
Mid-term recovery beginning 🔄
Long-term trend still needs confirmation ⚠️
---
🟢 Key Bitcoin Support Zones
1️⃣ Immediate Support: $77,000 – $77,200
This zone currently acts as the first defensive level for bulls.
Why important?
Previous consolidation happened here
MA support nearby
Buyers repeatedly entered here
If BTC holds above this level, bullish continuation becomes more likely.
---
2️⃣ Strong Demand Zone: $76,000 – $76,300 🔥
This is currently the strongest support visible on the chart.
Why this area matters:
✅ Previous reaction low
✅ High buying pressure
✅ Strong rejection wicks
✅ Psychological support
If BTC revisits this area again:
👉 Buyers may attempt another strong bounce.
However:
❌ If this zone breaks decisively, market sentiment may weaken quickly.
---
3️⃣ Major Macro Support: $75,000
This is a larger psychological level.
Breaking below this area could trigger:
Fear selling 😨
Liquidations ⚠️
Increased volatility 📉
BTC bulls must defend this region strongly.
---
🔴 Key Resistance Zones
1️⃣ Immediate Resistance: $78,300 – $78,500
BTC currently faces short-term resistance here.
Why?
Multiple candle rejections visible
Previous support turned resistance
Sellers active near this zone
If BTC breaks above this resistance with volume:
🚀 Momentum could accelerate rapidly.
---
2️⃣ Major Resistance: $79,600 – $80,000 🔥
This is the most important resistance currently.
Reasons:
✅ MA99 located nearby
✅ Strong historical resistance
✅ Psychological $80K level
✅ Heavy previous selling pressure
This zone may decide the next major trend direction.
---
3️⃣ Supply Zone: $81,000 – $82,000 📉
This is where BTC previously faced aggressive rejection.
Why it matters:
Large sell orders likely remain here
Profit-taking previously started here
Strong institutional distribution possible
BTC needs massive buying volume to reclaim this area.
---
🟢 Demand Zones Explained
Demand zones are areas where buyers aggressively enter the market.
Current BTC Demand Zones:
Zone Strength
$77K Medium
$76K Very Strong 🔥
$75K Critical
These zones suggest:
📈 Smart money still interested in buying dips.
---
🔴 Supply Zones Explained
Supply zones are areas where sellers dominate.
Current BTC Supply Zones:
Zone Strength
$78.5K Medium
$80K Very Strong 🔥
$82K Major Distribution
These are areas where traders may:
Take profits 💰
Open short positions 📉
Reduce exposure ⚠️
---
📊 Volume Analysis
Volume tells the real story behind price movement.
What the chart shows:
During the drop toward $76K:
✅ Selling volume increased heavily
But then:
✅ Buyers started absorbing selling pressure
✅ Recovery candles appeared
✅ Volume stabilized
This is important because:
👉 Healthy recoveries usually require strong buyer absorption.
Right now:
BTC needs increasing bullish volume to continue upward.
Without strong volume:
⚠️ The current bounce could become weak.
---
📉 Moving Average Analysis
MA7 (Short-Term Momentum)
BTC trading above MA7 suggests:
✅ Bulls regaining short-term control.
---
MA25 (Mid-Term Momentum)
Holding above MA25 is positive because:
✅ Recovery structure strengthens
✅ Buyers gaining confidence
---
MA99 (Long-Term Trend)
This remains the biggest challenge.
BTC still below MA99 means:
⚠️ Long-term trend confirmation not complete yet.
A breakout above MA99 could trigger:
🚀 Strong bullish continuation.
---
🧠 Market Psychology
Market psychology currently feels divided.
Bulls Believe:
BTC correction already happened ✅
Demand zones holding strong ✅
Institutional buying may return ✅
Next breakout could target new highs 🚀
Bears Believe:
BTC still below major resistance ❌
Macro uncertainty remains ⚠️
Volume not strong enough ❌
Another correction possible 📉
This creates:
🔥 A highly volatile environment
---
🚀 Bullish Scenario
For BTC to continue bullish momentum:
Conditions Needed:
✅ Hold above $77K
✅ Break $78.5K resistance
✅ Strong volume confirmation
✅ Reclaim $80K
If this happens:
Possible Targets:
🎯 $80,000
🎯 $81,000
🎯 $82,000
🎯 $84,000
Potentially even higher if momentum strengthens.
---
📉 Bearish Scenario
Bearish continuation becomes more likely if:
❌ BTC loses $77K support
❌ Sellers reclaim control
❌ Volume weakens
❌ $76K demand breaks
Then possible downside targets:
🎯 $75K
🎯 $73K
🎯 $72K
Panic selling may increase below these levels.
---
🌍 Macro Factors Affecting Bitcoin
BTC is no longer moving independently.
Several global factors now influence price heavily:
🏦 Federal Reserve Policy
Interest rate expectations impact risk assets strongly.
Higher rates:
📉 Usually pressure BTC.
Lower rates:
📈 Usually help BTC rally.
---
🌎 Geopolitical Tensions
Global uncertainty often increases:
Safe-haven demand
Volatility
Institutional hedging activity
---
💰 ETF & Institutional Flows
Institutional demand remains one of the biggest drivers.
Large ETF inflows can rapidly push BTC upward.
Outflows may increase corrections.
---
📊 Technical Indicators Overview
RSI (Relative Strength Index)
Current recovery suggests RSI likely improving from oversold conditions.
This supports:
📈 Short-term bullish momentum.
---
Structure Analysis
Current structure shows:
Higher lows forming ✅
Recovery attempt active ✅
Resistance still nearby ⚠️
Market currently in:
🔄 Transitional Phase
---
🧩 Smart Trading Strategy
For Bulls 🟢
Possible strategy:
Wait for confirmed breakout above resistance
Use proper stop losses
Avoid emotional entries
Important zones:
✅ Entry confirmations above $78.5K
🎯 Targets near $80K+
---
For Bears 🔴
Bearish setups stronger only if:
❌ BTC loses support zones
❌ Volume turns negative
Then downside momentum may accelerate.
---
⚠️ Risk Management
Crypto markets remain extremely volatile.
Important reminders:
✅ Never overleverage
✅ Use stop losses
✅ Protect capital first
✅ Avoid emotional trading
✅ Follow market structure carefully
---
🔥 Final Bitcoin Outlook
Right now Bitcoin appears to be:
🟢 Recovering inside a larger bullish structure
However:
⚠️ The market still needs confirmation above major resistance levels.
The strongest signal currently is:
✅ Buyers defending the $76K demand zone aggressively.
As long as BTC remains above key support:
📈 Bulls still have a strong chance to push higher.
But if support breaks:
📉 Volatility could increase rapidly.
---
🧠 Final Thoughts
Bitcoin continues behaving like a mature macro asset mixed with a high-volatility growth asset.
That combination creates:
Huge opportunity 🚀
Huge risk ⚠️
Massive volatility 📊
The next few trading sessions will likely decide whether:
✅ BTC resumes bullish continuation
OR
❌ Enters a deeper correction phase.
For now:
👀 All eyes remain on:
$77K support
$78.5K breakout
$80K resistance
The battle between bulls and bears is far from over. 🚀