
Based on the daily chart for the STG/USDT pair shown in the image .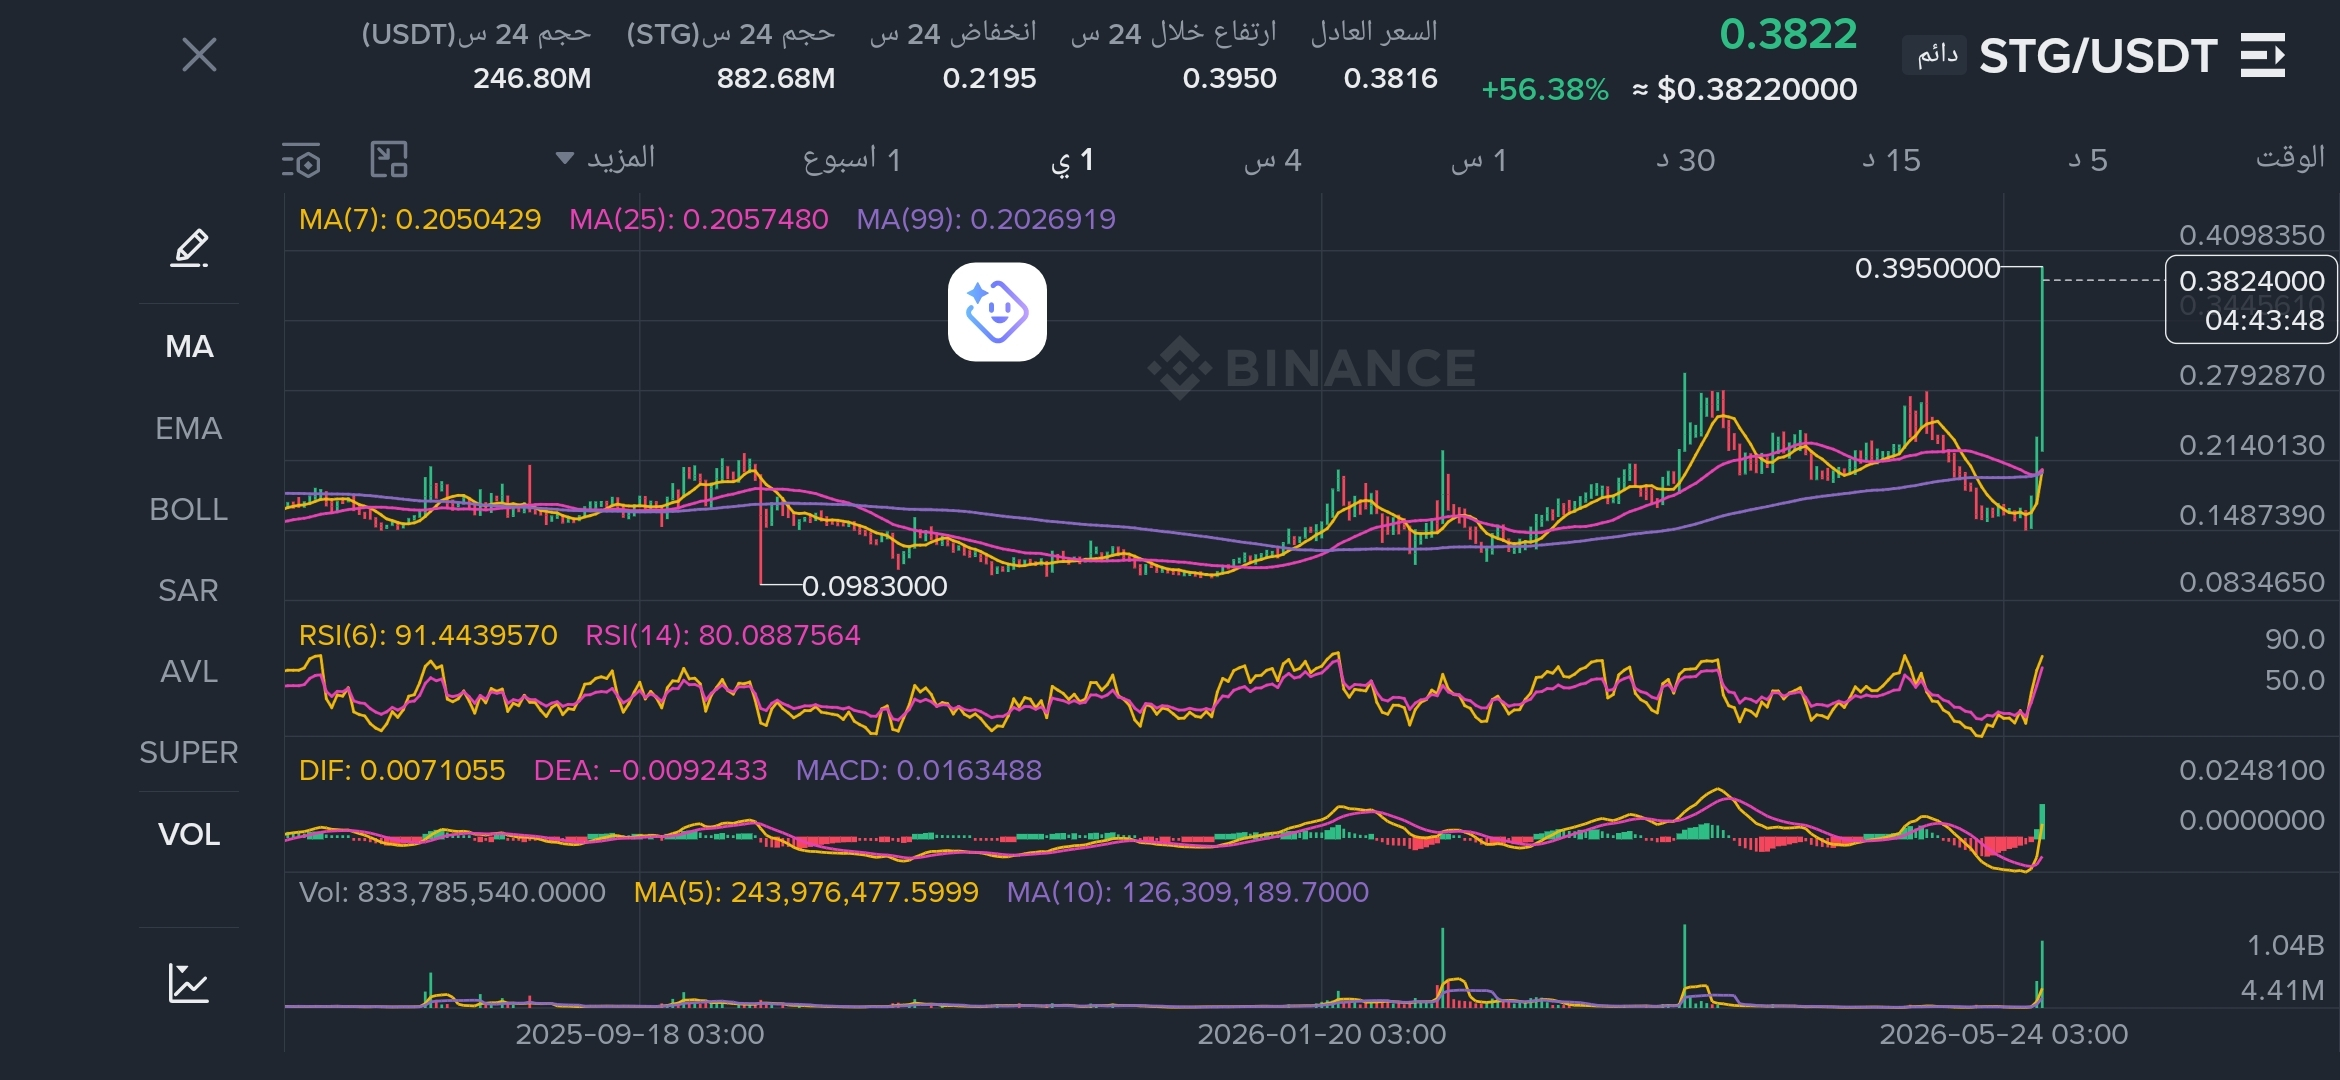 , here is a precise technical analysis featuring the key Support and Resistance levels to help you map out your trade setup:
🛑 Resistance Levels
Resistance levels represent zones where selling pressure and profit-taking are highly concentrated, preventing the price from climbing further in the short term:
First Resistance (Current Peak): 0.3950
Analysis: This is the exact local high reached during the recent massive bullish impulse (indicated by the horizontal line on the chart). The price immediately pulled back upon touching it, making it the strongest immediate barrier.
Second Resistance (Extended Target): 0.4100
Analysis: This acts as the next psychological and technical target if the price manages to break above the first resistance and close a daily candle firmly above it.
🟢 Support Levels
Support levels represent zones where buying interest is expected to step in, acting as a floor to prevent the price from entering a free fall:
First Support (Immediate Retest): 0.2800
Analysis: This level aligns with previous minor peaks formed during prior breakout attempts. The price frequently needs to drop and retest such broken resistances to confirm them as new valid support.
Second Support (Major Demand Zone): 0.2150
Analysis: This area served as a heavy ceiling for a multi-month accumulation/sideways phase. Since it was broken by a massive daily candle, it has now transformed into a major institutional demand zone and will act as a price magnet during a healthy market correction.
Third Support (Moving Averages): 0.2050
Analysis: This level converges perfectly with the daily Moving Averages, MA(7) and MA(25). A daily close below this zone would completely invalidate the current bullish structure.
🧭 How to Use These Levels for Trading
The Safe Buying Strategy: Avoid chasing the green candle at the current price (0.3822). Instead, wait for a healthy pullback to set buy orders around Support 1 (0.2800) or ladder down to Support 2 (0.2150) for a much safer risk-to-reward entry.
The Breakout Strategy: Alternatively, if the daily candle closes convincingly above 0.3950 with sustained high volume, you can look for a long position on the retest of that level, targeting 0.4100 and beyond.
Stop-Loss Management: If you enter near the support levels, your strict stop-loss should be a daily candle close below 0.1950 (just beneath the third support line).