Let's look at the Long-Term Macro Chart for Solana ($SOL ). History doesn't always repeat, but it definitely rhymes. 🔄
Here is a breakdown of a fascinating cyclical pattern based on Fibonacci retracements and previous bear market bottoms:
📊 The 700% Bottom Fractal
Cycle 1 Bottom: In the previous bear cycle, Solana dropped below the 0.786 Fibonacci level, finding its absolute floor at $8.00.
The Growth: That $8.00 bottom was exactly 700% higher than its previous historical minimum of around $1.03.
Cycle 2 (Current): Fast forward to today, $SOL has once again broken below the 0.786 Fib line.
The Math: If we apply the exact same 700% growth rule from the previous bottom ($8.00), the mathematical target for this cycle's floor sits right at $64.00.
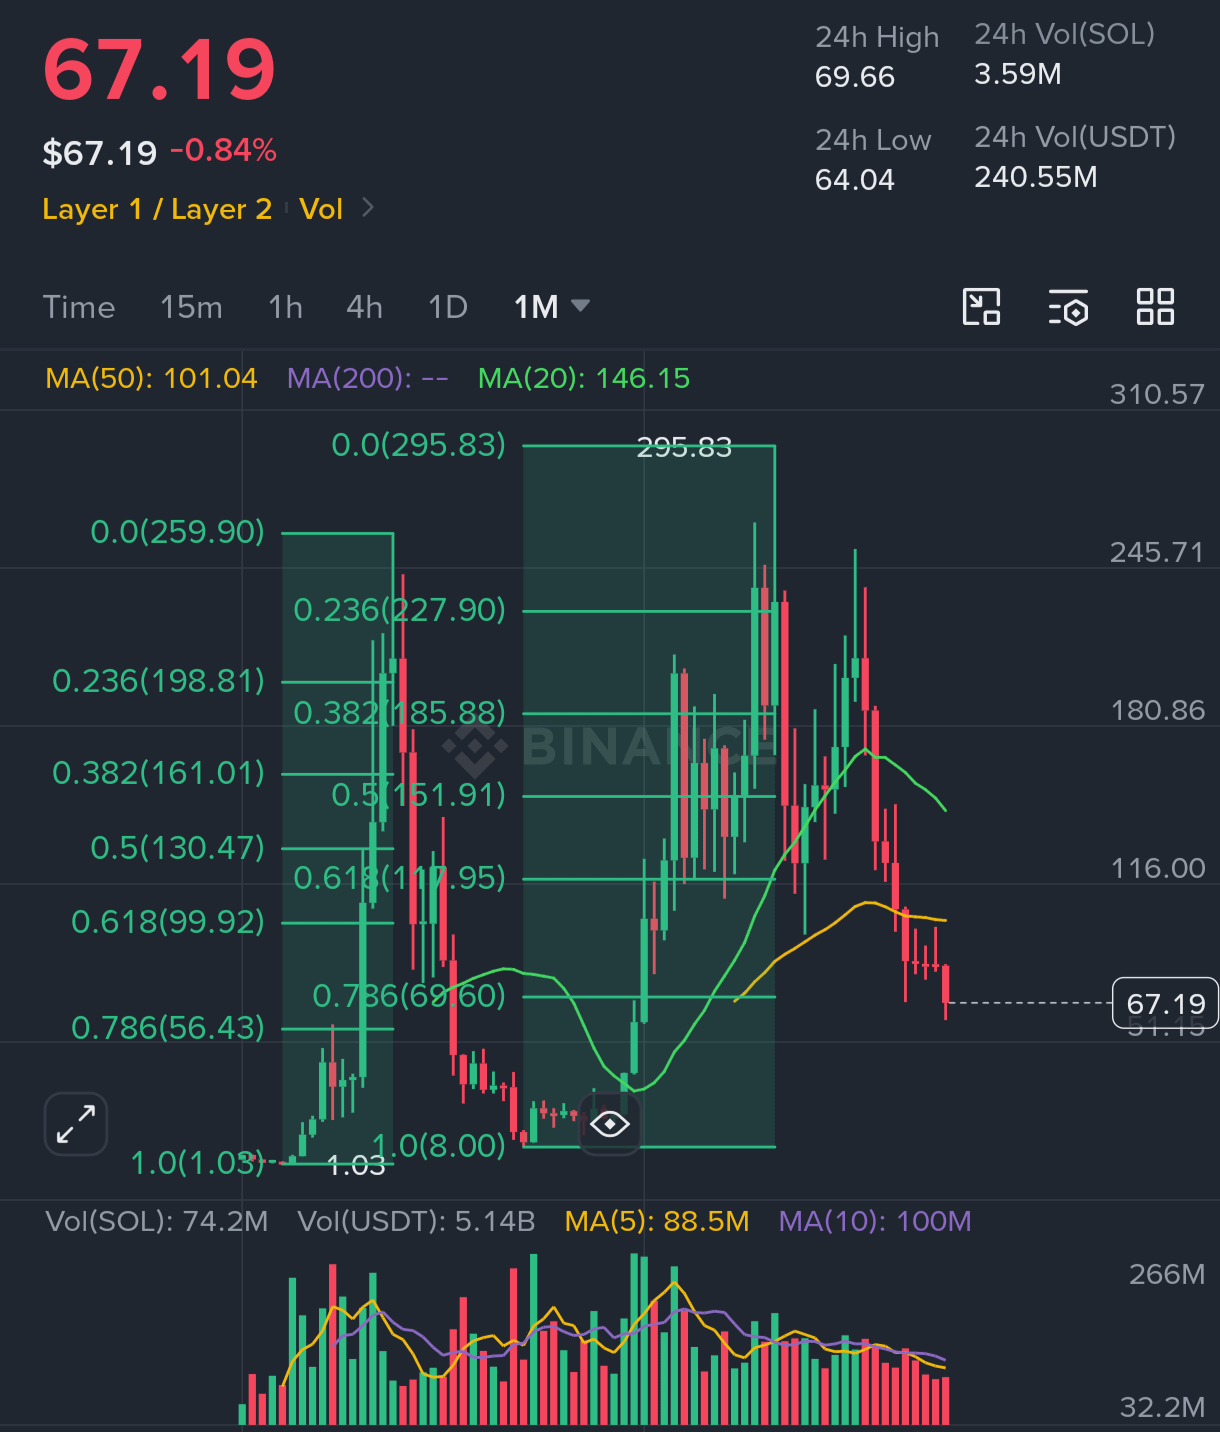
📉 Where Are We Now?
SOL recently wicked down, touching the $60.00 area.
Price is currently hovering around $67.08, showing deep oversold conditions on the macro indicators.
The Relative Strength Index (RSI) is sitting at historical lows, screaming exhaustion from sellers.
💡 My Conclusion & Strategy
We are extremely close to the absolute macro bottom for this cycle. While the mathematical target was $64, extreme market panic could flash-crash the price slightly lower.
Estimated Bottom Range: $45 - $55
Action Plan: Dollar-Cost Averaging (DCA) into spot positions within this zone for the next massive long-term expansion.

What's your move? Are you buying the dip or waiting for lower targets? Let me know below! 👇
#SOL #CryptoAnalysis #TechnicalAnalysis #Fibonacci