
#Aptos #APT #APTUSDT #altcoins
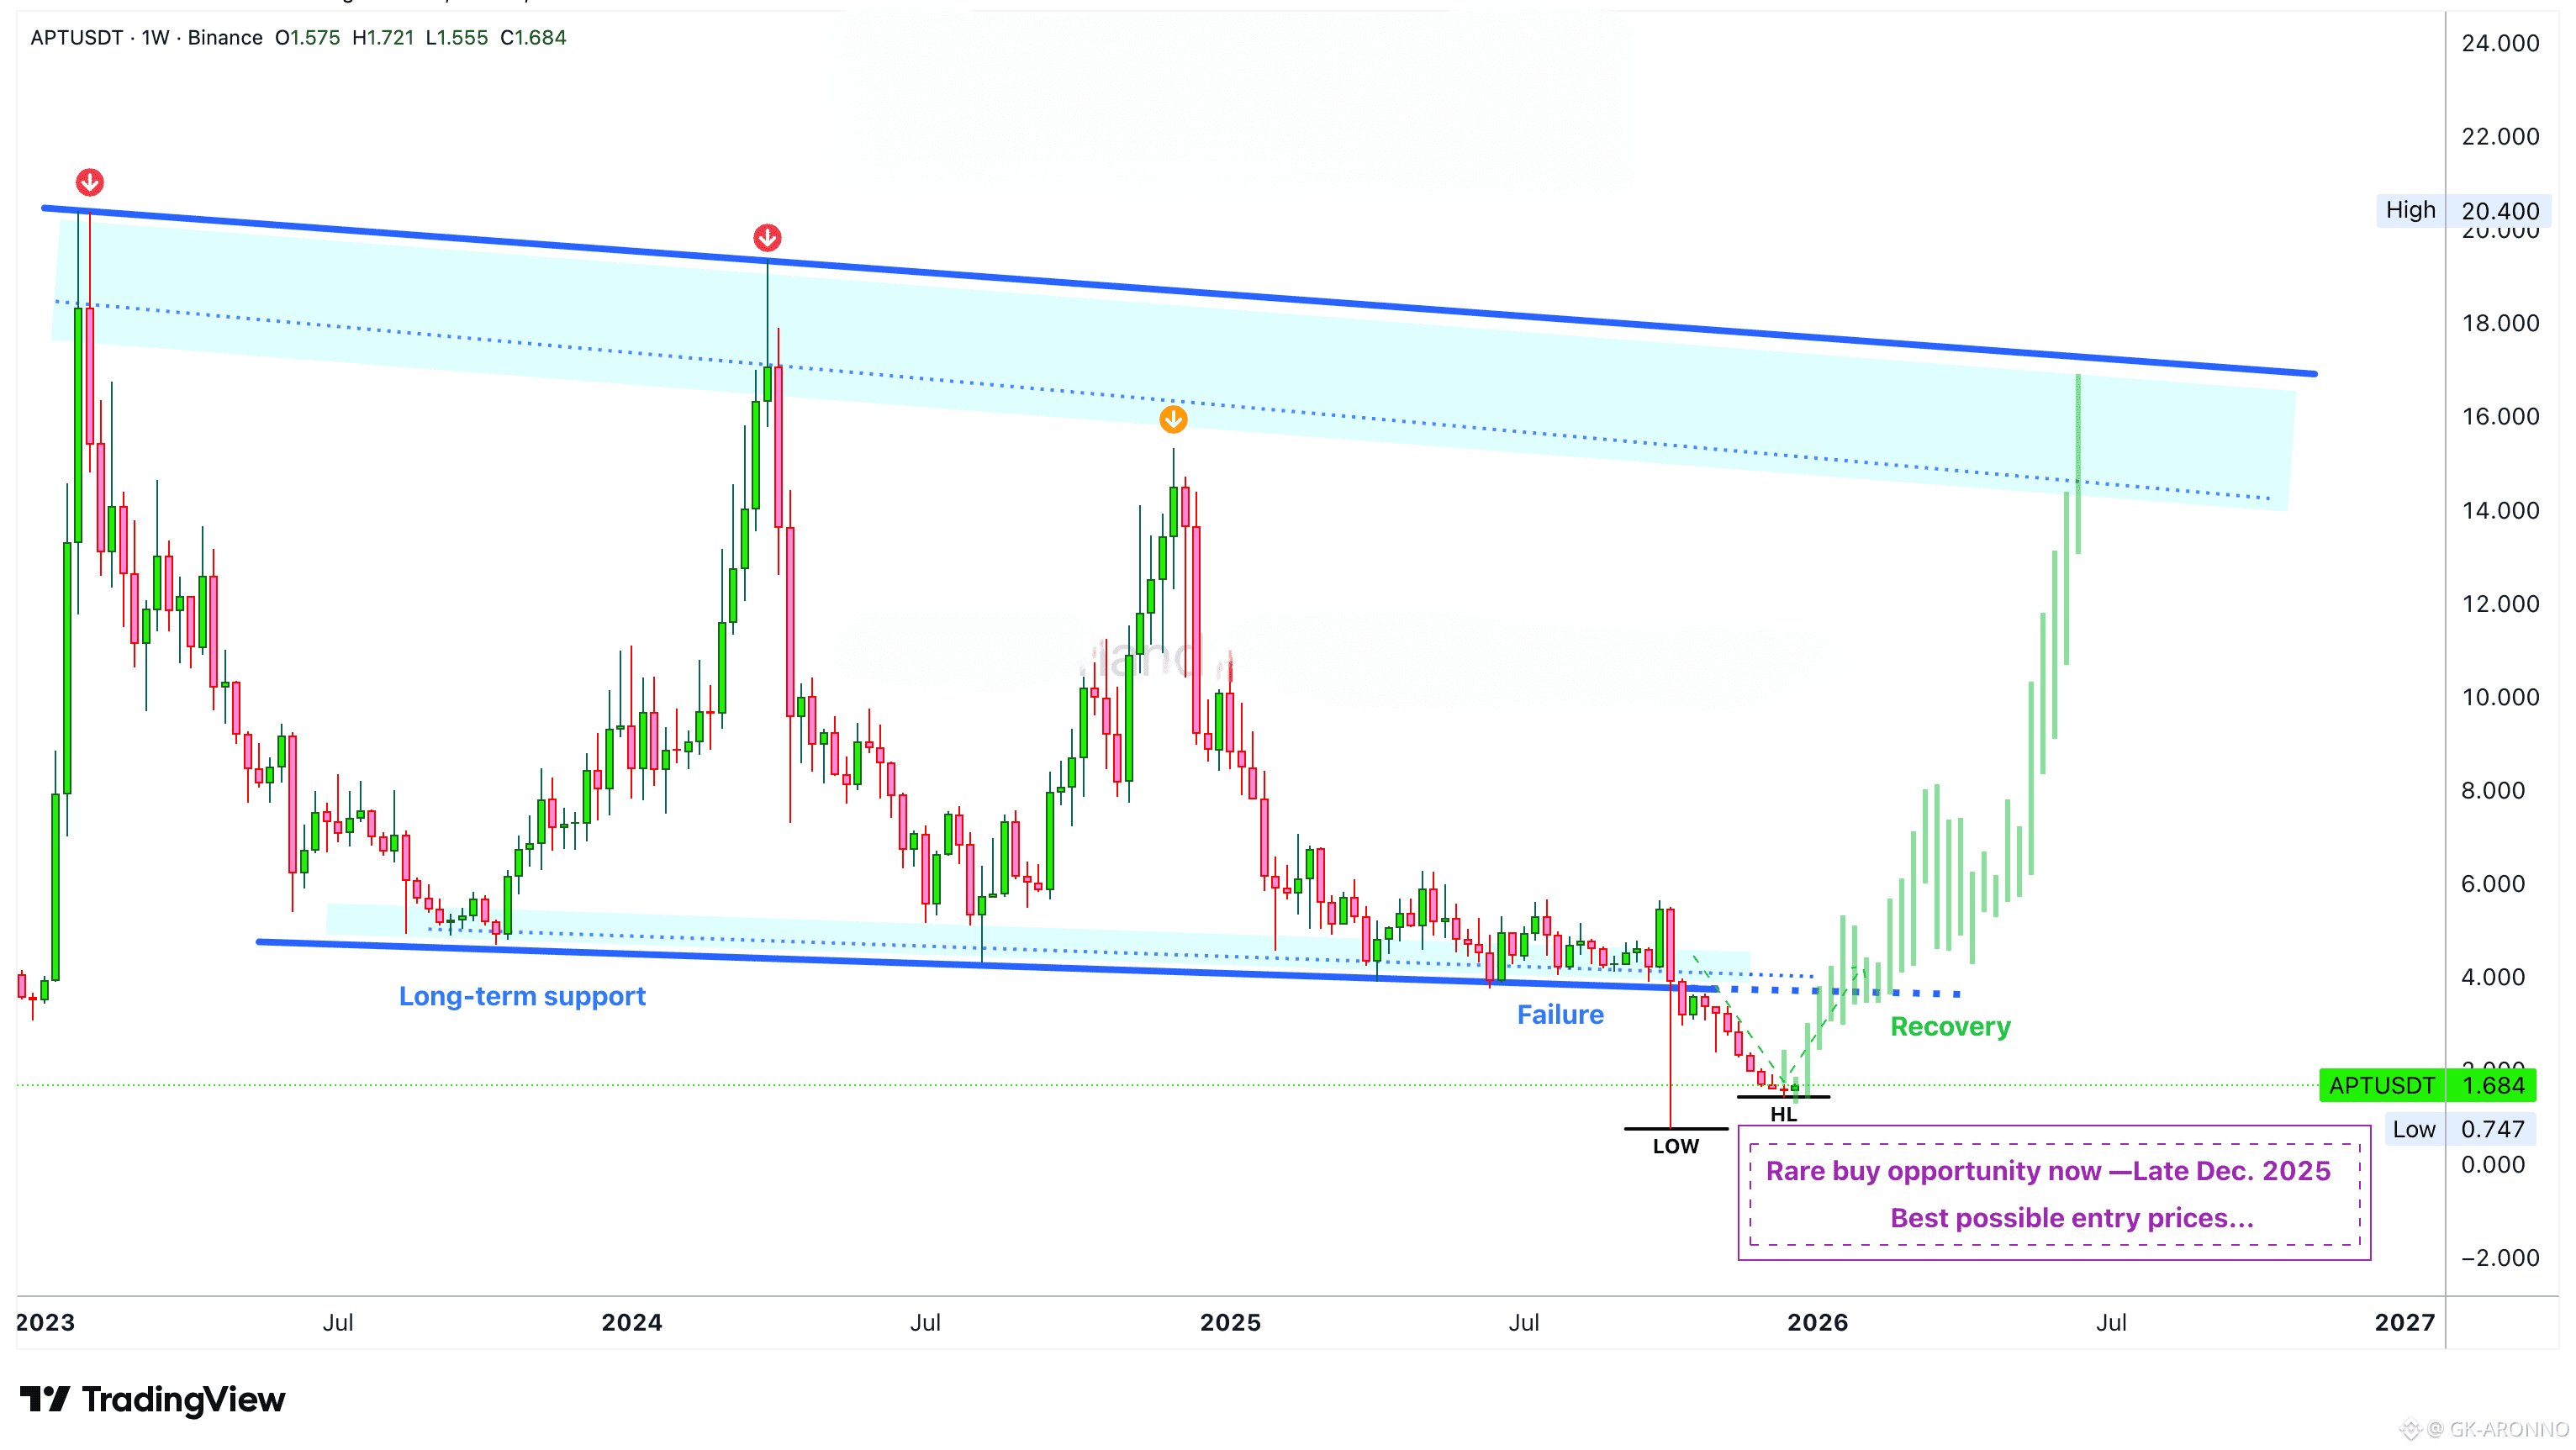
The blue channel is a long-term chart structure. Aptos produced lower highs long-term and this led to a lower low. The lower lows ended with a liquidity hunt event and this create a bullish scenario. A very strong bullish bias is now present on this chart.
The low in October marked the bottom. The low last week is a higher low (HL). We can easily see how this move went beyond the main chart pattern. This type of move tends to lead to a "v shaped" recovery. The action will first move back above support and from this point a strong bullish impulse will follow.
Chart patterns like this one are not uncommon. If I were to show you some of the legacy projects you can see the same pattern repeating hundreds of times before a major bullish cycle.
The market reaches bottom and goes sideways at support. The next market phase is a bullish cycle but before this cycle we get one final stop-loss hunt; a liquidity hunt or market flush. As soon as this move is in, the next phase unravels with full force. We are seeing the first green week in months.
The next wave can be similar to early 2023 or late 2023. Sustained, or fast, growth.
The market can be unforgiving when going down. When going up, it can grow non-stop for months. The market will always seek balance; we are going up next. You can bet on it.
Namaste.
✅ Trade here on $APT
