In the world of crypto trading on Binance, technical indicators act as the "eyes" of a trader. Two of the most popular tools used to decipher market trends and volatility are Exponential Moving Averages (EMA) and Bollinger Bands (BOLL).
While they look like a tangle of lines on your screen at first, they provide a structured way to understand where the price has been and where it might be headed.
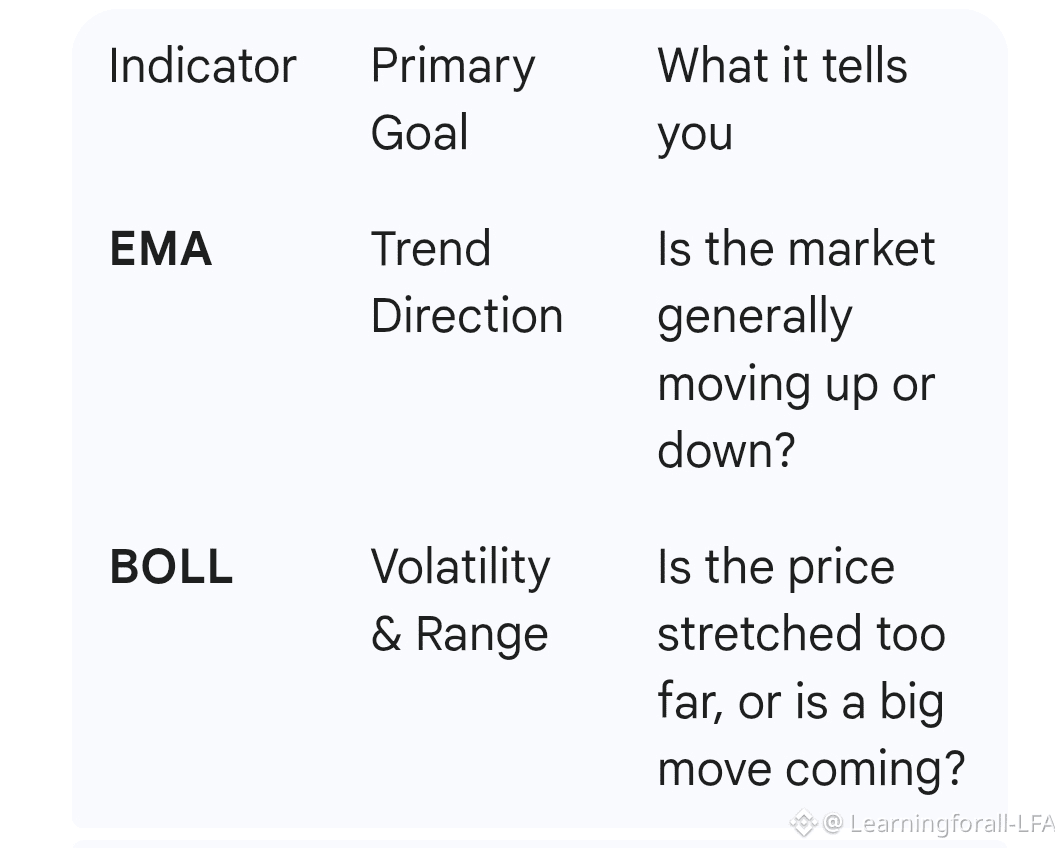
1. Exponential Moving Average (EMA)
The EMA is a type of moving average that places a greater weight and significance on the most recent data points. Unlike a Simple Moving Average (SMA), which treats all prices equally, the EMA reacts faster to recent price changes.
How it works: It "smooths" out price action to identify the trend direction.
The "Crossover" Strategy: On Binance, traders often use two EMAs (like the 7-period and 25-period). When the shorter EMA crosses above the longer one, it’s a bullish signal; when it crosses below, it’s bearish.
2. Bollinger Bands (BOLL)
Bollinger Bands measure volatility. They consist of a middle band (usually a 20-period SMA) and two outer bands that expand and contract based on market movements.
The Squeeze: When the bands tighten, it indicates low volatility and often precedes a massive price breakout.
Overbought/Oversold: If the price touches the upper band, the asset may be overbought (due for a pullback). If it touches the lower band, it may be oversold (due for a bounce).#BTC90kChristmas #WriteToEarnUpgrade