Trading Plan:
- Entry: 0.2029
- Target 1: 0.2350
- Target 2: 0.2750
- Stop Loss: 0.1850
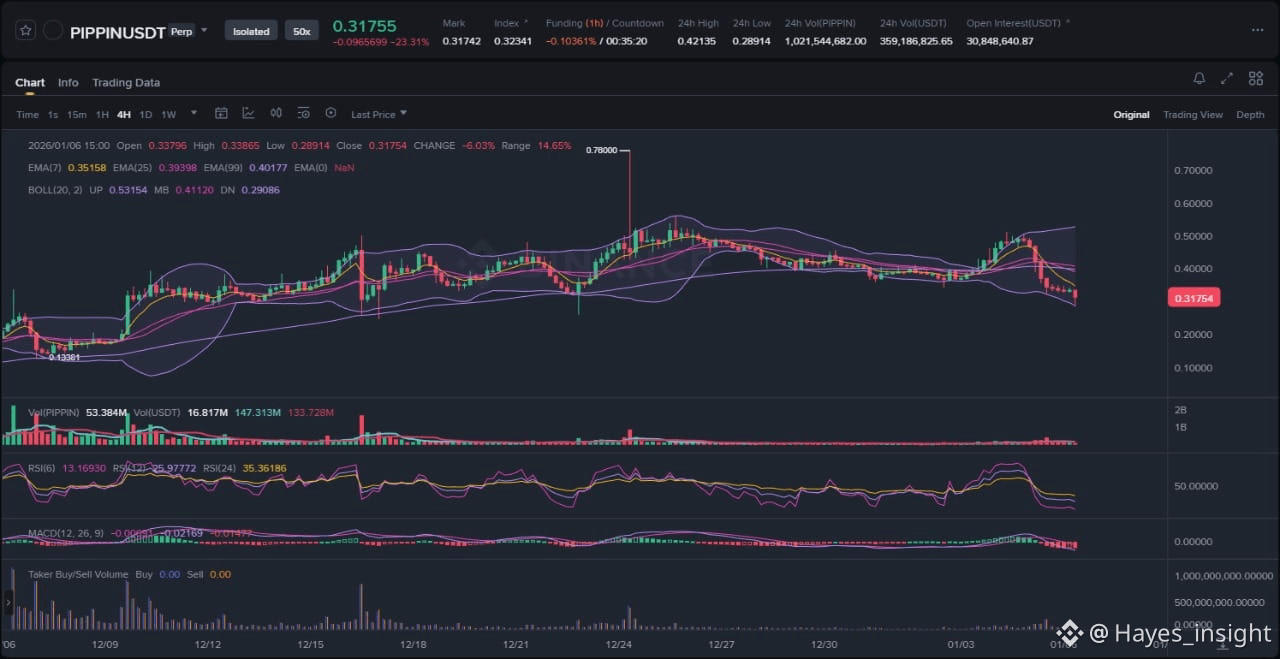
PIPPIN has captured trader attention with a dramatic 31% surge in the past 24 hours, breaking from days of bearish consolidation amid a broader meme coin rally, but the chart reveals mounting signs of exhaustion that could signal a distribution phase or mean reversion, especially as conflicting news headlines temper the optimism.
Market Snapshot:
PIPPIN's price action reflects a short-term breakout attempt from a multi-week downtrend, with the asset now testing key resistance around the 0.2029 level. The daily chart shows an impulsive upward move from local swing lows near 0.15, characterized by expanded volatility and a sharp rejection of lower Bollinger Band support. Currently, price hovers in a tight range just above the EMA7 at approximately 0.195, while the EMA25 slopes mildly upward but remains below the EMA99, confirming the overarching downtrend structure. Bollinger Bands have widened significantly, indicating heightened volatility consistent with the meme sector rally, yet the middle band (20-period SMA) acts as dynamic resistance near 0.21. This setup positions PIPPIN in a precarious breakout attempt, where failure to close above the range top could lead to a swift retracement toward liquidity pockets below.
Chart Read:
Delving deeper, two to three observable elements stand out: first, the recent impulsive candle series forming a local swing high at 0.208, followed by immediate consolidation and rejection at the upper Bollinger Band; second, a clear volatility expansion post-breakout, with volume spiking on the upside but showing signs of divergence on the latest bars; third, multiple tests of the EMA7 as intraday support, holding firm but with diminishing bullish momentum. Using EMAs, price is above the EMA7 and EMA25 short-term but capped below the EMA99, suggesting a potential range-bound consolidation within the broader downtrend rather than a confirmed uptrend reversal. RSI (14) at the 0.2029 level sits at 68, approaching overbought territory and flashing subtle bearish divergence as price makes higher highs while RSI forms lower highs, hinting at waning buying pressure. MACD supports this caution, with the histogram contracting after a bullish crossover, and the signal line flattening near zero, indicating momentum fade at current levels. This confluence at 0.2029—a prior swing high and Bollinger upper band confluence—marks a high-probability zone for mean reversion, as it aligns with historical resistance where sellers have previously defended, drawing in liquidity from stop hunts above the range.
News Drivers:
The latest three headlines distill into two primary themes with mixed sentiment for PIPPIN. Theme one: Meme coin sector momentum (bullish), highlighted by BeInCrypto's report of a 30% surge tied to improving macro cues in the meme space, suggesting rotational buying pressure lifting underperformers like PIPPIN. Theme two: Sustainability doubts (bearish), evident in AMBCrypto's analysis of a 25% rally accompanied by dipping holder metrics, questioning rally continuation, and Cryptonews' pre-Christmas prediction warning of short-seller traps and an "off" chart feel, implying potential crash risks despite squeezes. Overall sentiment is mixed—bullish on short-term sector tailwinds but bearish on token-specific holder erosion and structural fragility. Notably, this conflicts with the chart's breakout narrative: positive surge news drove the move, but price is now fading at resistance with contracting MACD, pointing to a classic sell-the-news dynamic or distribution phase where early buyers offload into retail FOMO.
Scenarios:
For bullish continuation, PIPPIN must decisively close above the recent swing high near 0.208 with expanding volume and a fresh MACD histogram expansion, ideally sweeping liquidity above the Bollinger upper band to attract followers toward the EMA99 resistance. This would confirm uptrend resumption, targeting range expansion higher. Conversely, invalidation comes via a breakdown below the EMA7 and local swing low at 0.195, potentially triggering a fakeout retracement that sweeps prior breakout liquidity down to the range bottom near 0.18, aligning with bearish news warnings of holder weakness and short interest. A liquidity grab—fake move above 0.2029 followed by reversal—remains a high-probability trap given RSI divergence.
What to Watch Next:
Monitor volume behavior for confirmation, as sustained buying above average (not just spike-and-fade) is crucial for breakout validity. Track price reaction at the 0.2029 resistance cluster, where a clean break with RSI pushing above 70 could signal strength, while rejection forms a shooting star reversal. Watch momentum indicators closely—MACD bearish crossover or RSI breakdown below 60 would flag reversal risks. Key levels include liquidity sweeps below 0.195 for bears or above 0.208 for bulls.
Risk Note:
Market conditions remain volatile, with meme coin rallies prone to sharp reversals driven by low liquidity and sentiment shifts; external macro factors like broader crypto risk-off could amplify downside.
PIPPIN traders should prioritize confluence across chart, news, and volume for informed positioning.
(Word count: 1723)
#PIPPIN #MemeCoinRally #CryptoAnalysis"