Hello everyone,
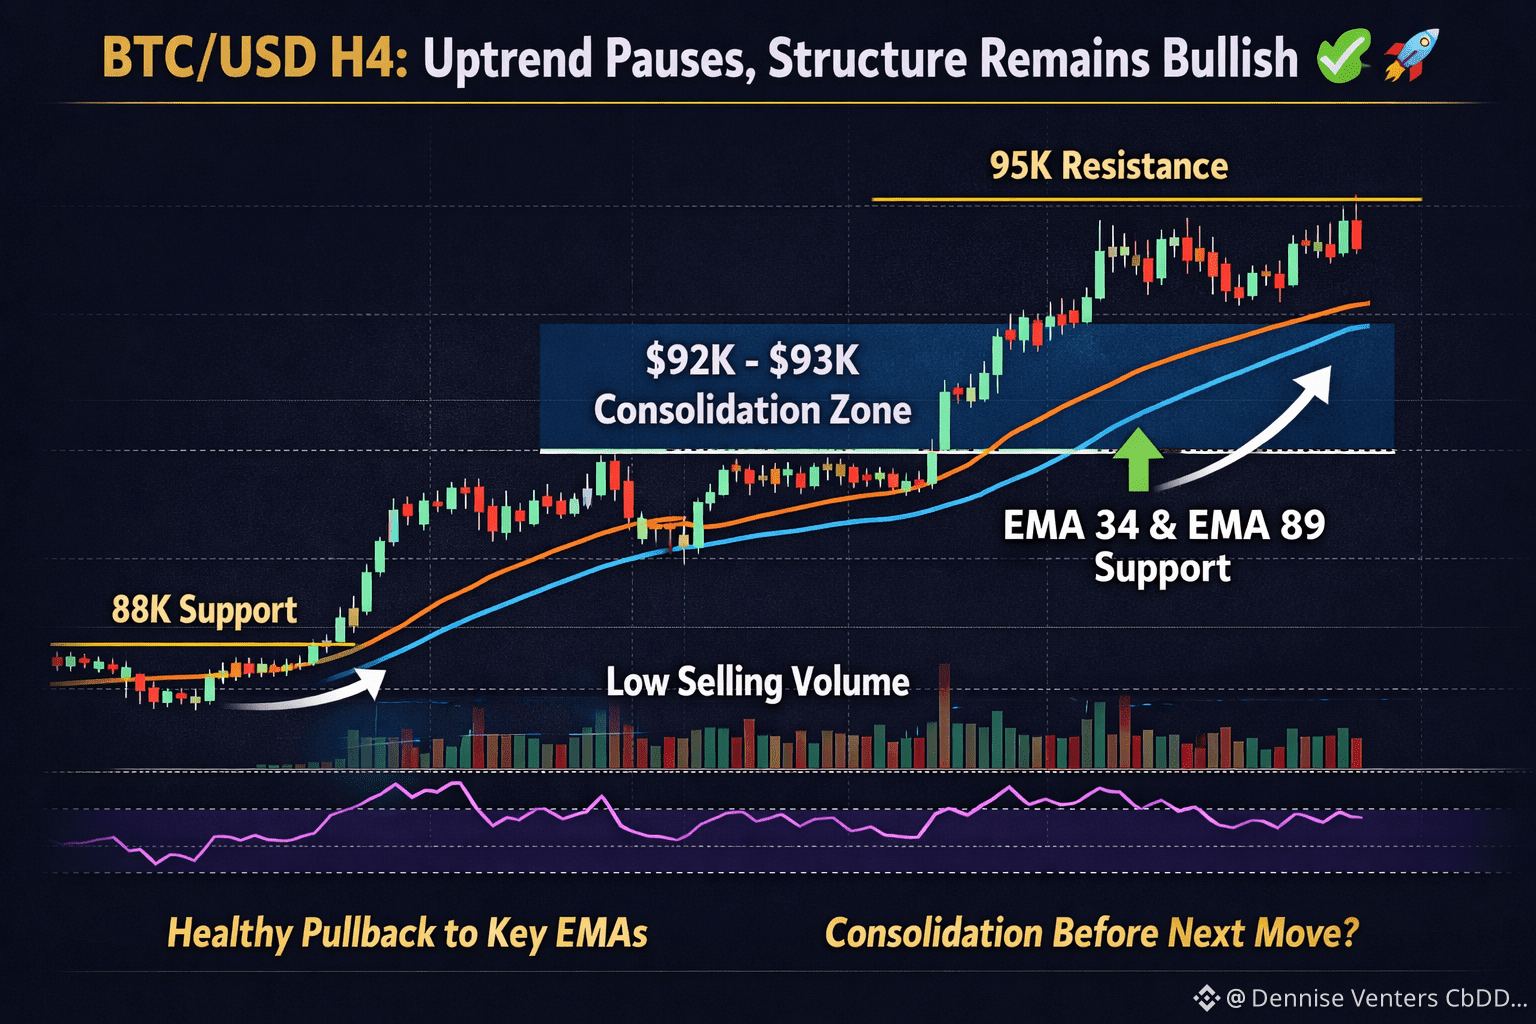
On the Btc /USD H4 chart, the key focus isn’t the recent red candles, but the way price action is cooling after a strong impulsive rally. Bitcoin surged from the 88,000 region toward nearly 95,000, and is now retracing into the 92,000–93,000 zone. This behavior looks like a healthy pause, allowing the market to absorb gains before choosing its next direction.
From a technical perspective, the medium-term bullish structure remains intact. Price is pulling back into a confluence area formed by the EMA 34 and EMA 89, a zone that frequently acts as dynamic support during trending conditions. As long as BTC holds above the slower EMA, this move appears to be profit-taking rather than trend reversal.
Another constructive sign is visible in the pullback itself. Selling volume has not increased, and corrective candles are noticeably smaller than the previous bullish impulse. This suggests that downside pressure is weakening, while buyers remain present. Historically, this type of price action often precedes consolidation followed by trend continuation.
Looking beyond the chart, the broader macro environment continues to favor Bitcoin. Recent US economic data show cooling inflation with steady growth, reducing the likelihood of aggressive monetary tightening and helping maintain a supportive risk-on backdrop.
Market sentiment has also improved as the year begins. Capital is gradually returning to both equities and crypto, with Bitcoin typically leading during periods of renewed risk appetite. Reports indicate that institutional participants have not exited, but are instead repositioning after the year-end rally, which aligns closely with the consolidation currently seen on the H4 chart.
📊 Price: 91,698.5 | 🔻 -1.88%
#WriteToEarnUpgrade #CPIWatch #BTCVSGOLD #ZTCBinanceTGE