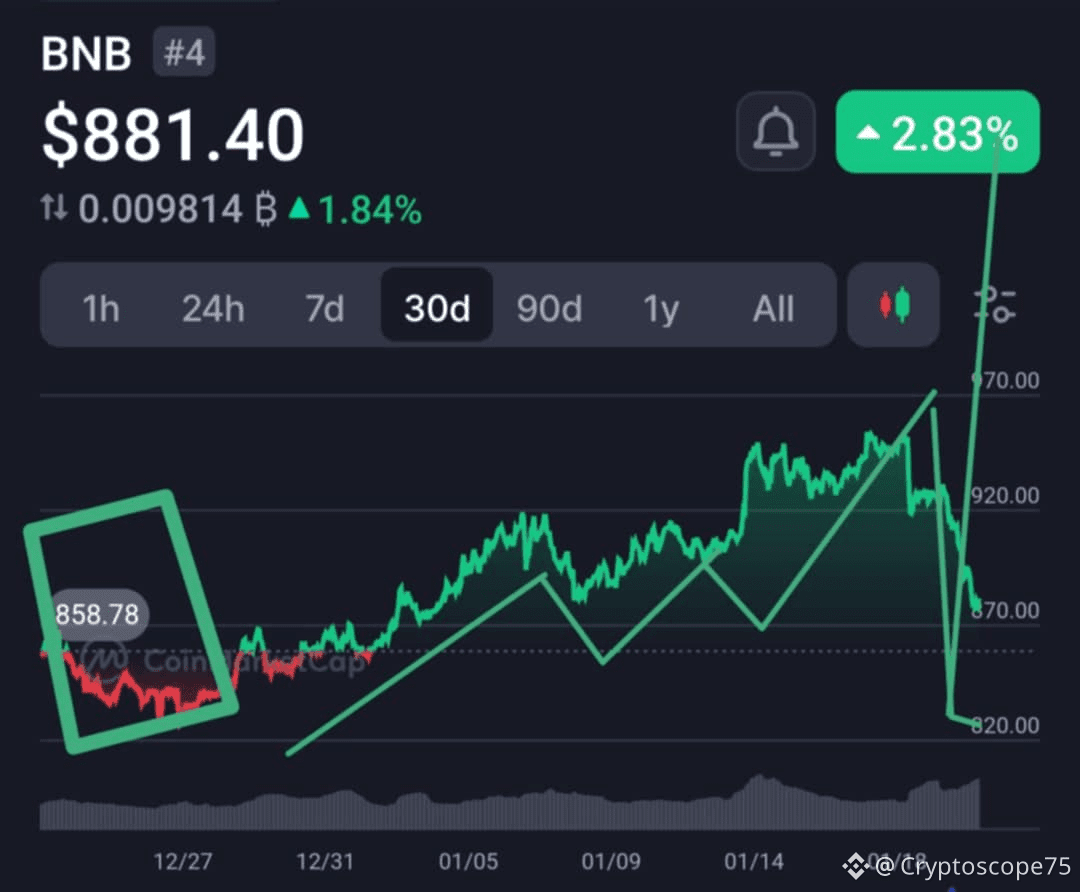
The 30-day chart of BNB shows a market that has remained firmly bullish, with price advancing from its consolidation base near the mid-800s to a powerful expansion phase that has now driven BNB toward the 1,300 level. Throughout the month, the structure has been defined by higher highs and higher lows, confirming sustained trend control by buyers.
Key observations from the chart
BNB first spent time consolidating in the $850–$860 region, forming a clear accumulation range. This base provided the foundation for a steady, staircase-style advance, where each impulse leg was followed by brief, controlled pullbacks.
As price moved higher, multiple corrections occurred, but every retracement respected prior support, reinforcing the strength of the bullish structure and indicating consistent dip-buying interest.
A notable volatility event occurred when BNB briefly dropped toward the $820 area, but the move was aggressively absorbed, triggering a sharp vertical recovery. That reaction signaled strong underlying demand and marked the transition into the current acceleration phase, which has since carried price toward 1,300.
Market structure insight
The chart reflects:
Sustained bullish momentum over the month
Repeated confirmation of support at higher levels
Aggressive dip-buying and rapid recovery from downside shocks
Elevated volatility, likely influenced by leverage and large participants
Despite wide intraday swings, the broader technical structure remains decisively bullish as long as BNB continues to hold above its major higher-low zones.
Conclusion
BNB’s 30-day performance illustrates a market in trend expansion rather than distribution. Each corrective phase has acted as a reset, followed by continuation to new highs. The advance toward 1,300 strengthens the view that buyers remain in control, although the speed of the move also implies rising volatility and increased risk, making disciplined risk management essential.
