

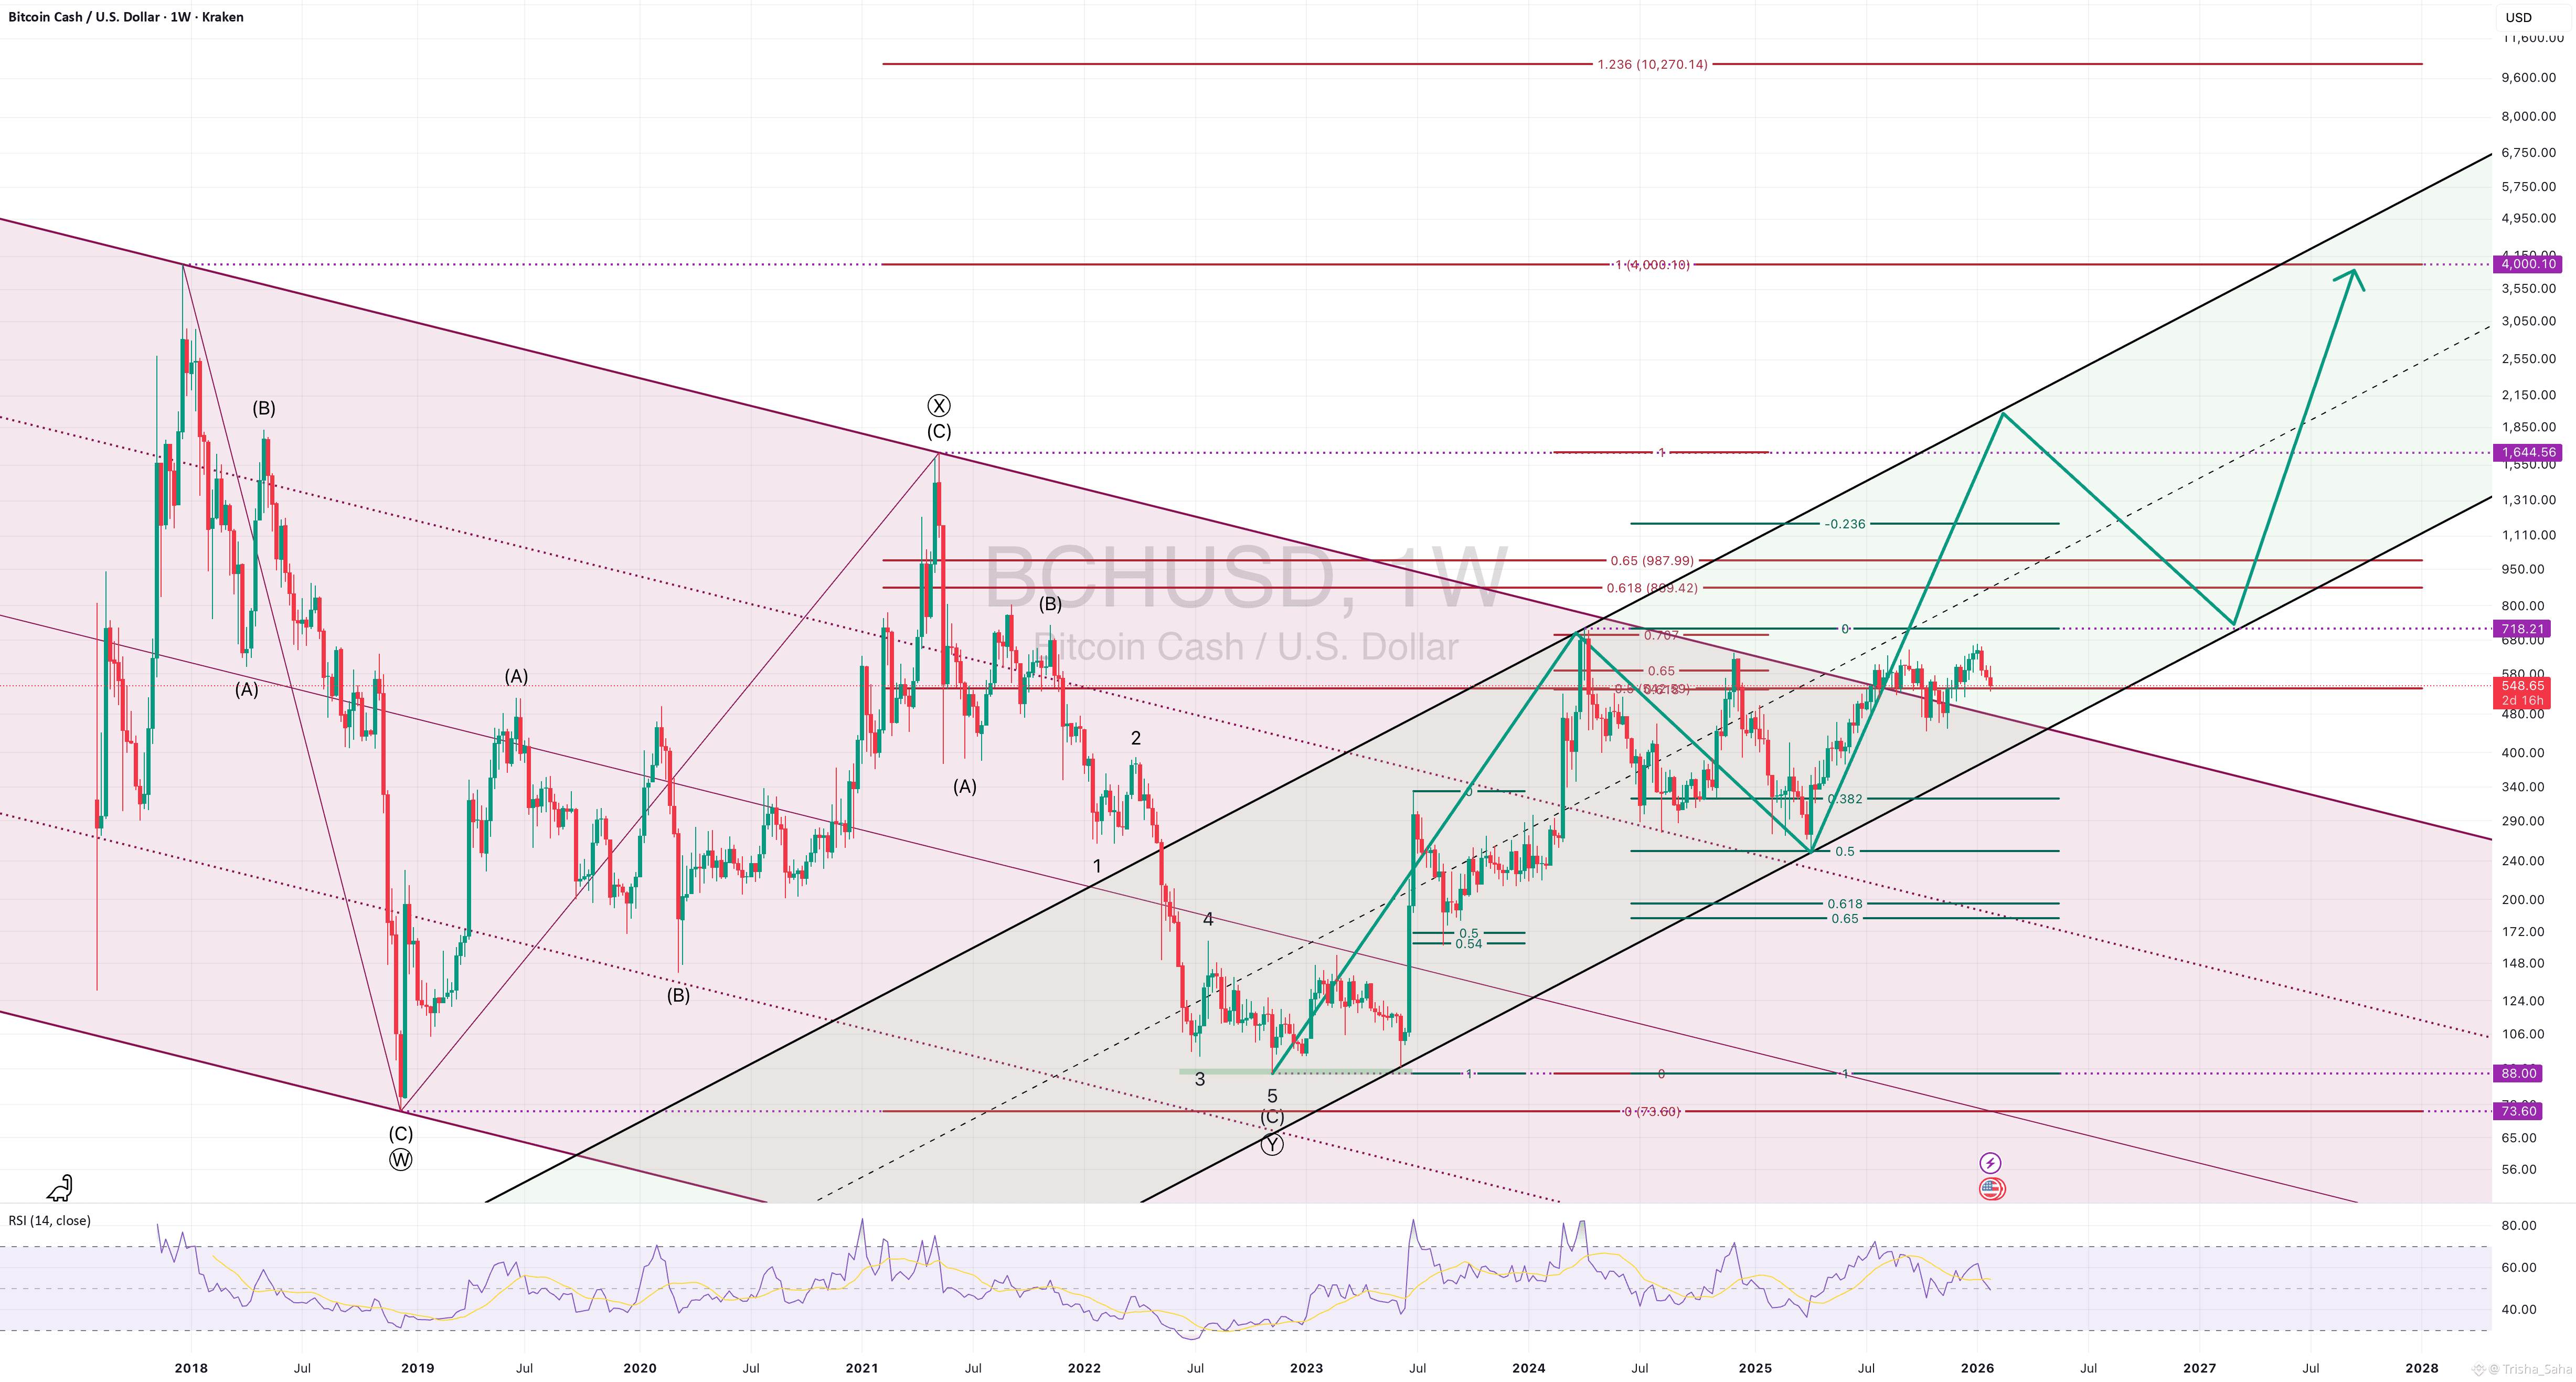
BCH – Weekly Structure Overview (Update 2)
BCH appears to have completed a major W-X-Y multi-zigzag corrective structure to the downside. Price has since transitioned into a motive phase, advancing within the rising green channel and breaking above the former bearish channel, signalling a potential trend reversal.
As long as BCH remains within this ascending structure, the path of least resistance points higher. If bullish momentum continues, price could challenge the next key resistance zones near $870 and $1,645, which align with higher-degree Fibonacci projections and prior structural levels.
Invalidation occurs on a sustained breakdown below the lower boundary of the green channel.
Like and follow for more charts like this.

BCHUSDT
دائم
485.45
-12.70%