
Price action is the foundation of technical analysis. Before indicators, algorithms, or automated systems existed, markets moved based on human behavior and that behavior is recorded directly on the price chart.
Classical chart patterns are among the most widely recognized tools in price action trading. They appear repeatedly across different market cycles and asset classes, from stocks and forex to cryptocurrencies. These patterns reflect crowd psychology at key moments of accumulation, distribution, continuation, and reversal.
In this guide, we’ll walk through the most common classical chart patterns, how they form, and why many traders still rely on them to identify potential trading opportunities and manage risk more effectively.
A flag is an area of consolidation that’s against the direction of the longer-term trend and happens after a sharp price move. It looks like a flag on a flagpole, where the pole is the impulse move, and the flag is the area of consolidation.
Flags may be used to identify the potential continuation of the trend. The volume accompanying the pattern is also important. Ideally, the impulse move should happen on high volume, while the consolidation phase should have lower, decreasing volume.
Bull flag
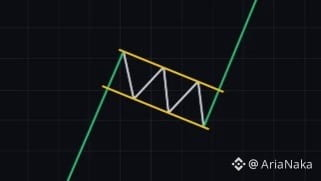
The bull flag happens in an uptrend, follows a sharp move up, and it’s typically followed by continuation further to the upside.
Bear flag
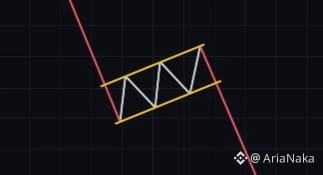
The bear flag happens in a downtrend, follows a sharp move down, and it’s typically followed by continuation further to the downside.
Pennant
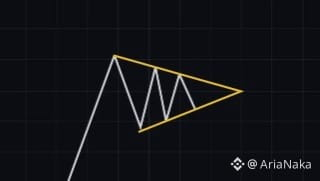
Pennants are basically a variant of flags where the area of consolidation has converging trend lines, more akin to a triangle. The pennant is a neutral formation; the interpretation of it heavily depends on the context of the pattern.
Triangles
A triangle is a chart pattern that’s characterized by a converging price range that’s typically followed by the continuation of the trend. The triangle itself shows a pause in the underlying trend but may indicate a reversal or a continuation.
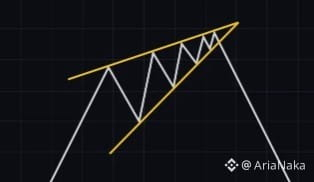
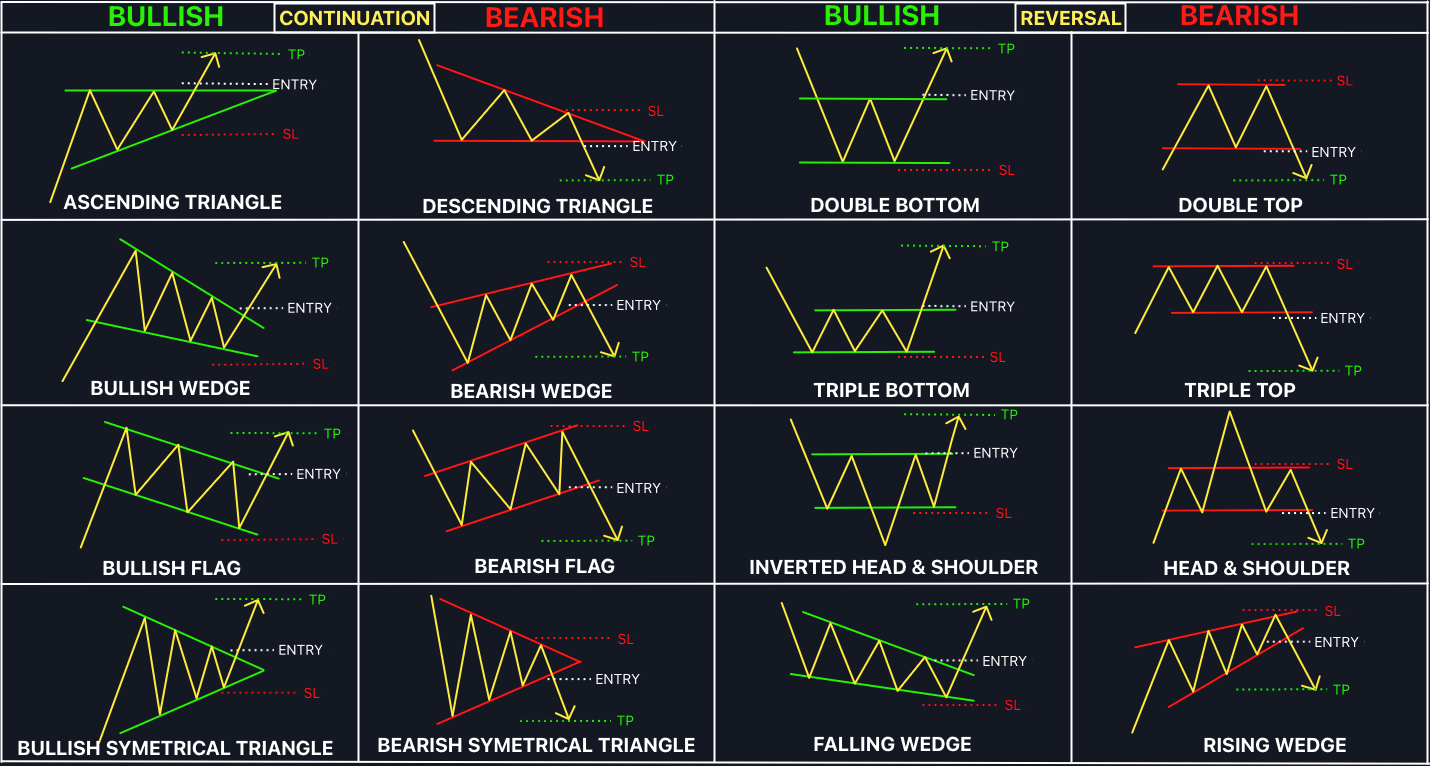
Ascending triangle
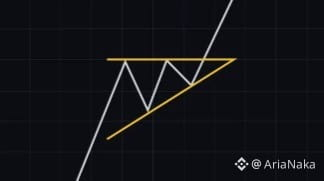
The ascending triangle forms when there’s a horizontal resistance area and a rising trend line drawn across a series of higher lows. Essentially, each time the price bounces off the horizontal resistance, the buyers step in at higher prices, creating higher lows. As tension is building at the resistance area, if the price eventually breaks through it, it tends to be followed by a quick spike up with high volume. As such, the ascending triangle is a bullish pattern.
Descending triangle
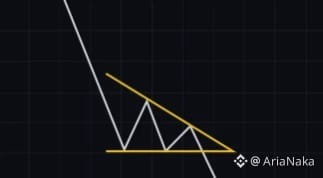
The descending triangle is the inverse of the ascending triangle. It forms when there’s a horizontal support area and a falling trend line drawn across a series of lower highs. In the same way as the ascending triangle, each time price bounces off the horizontal support, sellers step in at lower prices, creating lower highs. Typically, if the price breaks through the horizontal support area, it’s followed by a quick spike down with high volume. This makes it a bearish pattern.
Symmetrical triangle
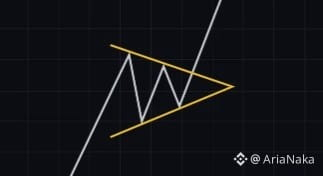
The symmetrical triangle is drawn by a falling upper trend line and a rising lower trend line, both happening at roughly an equal slope. The symmetrical triangle is neither a bullish nor a bearish pattern, as its interpretation heavily depends on the context (namely, the underlying trend). On its own, it’s considered to be a neutral pattern, simply representing a period of consolidation.
Wedges
A wedge is drawn by converging trend lines, indicating tightening price action. The trend lines, in this case, show that the highs and lows are either rising or falling at a different rate.
It might mean that a reversal is impending, as the underlying trend is getting weaker. A wedge pattern may be accompanied by decreasing volume, also indicating that the trend might be losing momentum.
Rising wedge
The rising wedge is a bearish reversal pattern. It suggests that as the price tightens up, the uptrend is getting weaker and weaker, and may finally break through the lower trend line.
Falling wedge
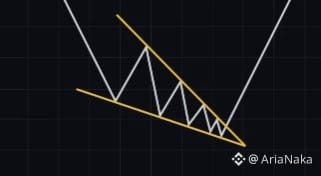
The falling wedge is a bullish reversal pattern. It indicates that tension is building up as price drops and the trend lines are tightening. A falling wedge often leads to a breakout to the upside with an impulse move.
Double top and double bottom
Double tops and double bottoms are patterns that occur when the market moves in either an “M” or a “W” shape. It’s worth noting that these patterns may be valid even if the relevant price points aren’t exactly the same but close to each other.
Typically, the two low or high points should be accompanied by higher volume than the rest of the pattern.
Double top
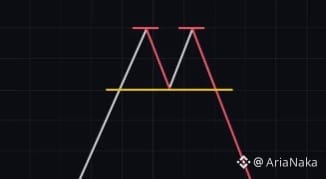
The double top is a bearish reversal pattern where the price reaches a high two times and it’s unable to break higher on the second attempt. At the same time, the pullback between the two tops should be moderate. The pattern is confirmed once the price breaches the low of the pullback between the two tops.
Double bottom
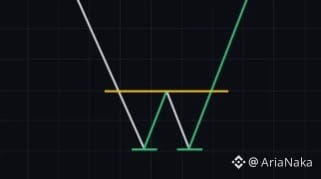
The double bottom is a bullish reversal pattern where the price holds a low two times and eventually continues with a higher high. Similarly to the double top, the bounce between the two lows should be moderate. The pattern is confirmed once the price reaches a higher high than the top of the bounce between the two lows.
Head and shoulders
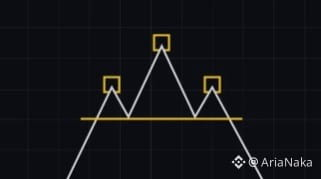
The head and shoulders is a bearish reversal pattern with a baseline (neckline) and three peaks. The two lateral peaks should roughly be at the same price level, while the middle peak should be higher than the other two. The pattern is confirmed once the price breaches the neckline support.
Inverse head and shoulders
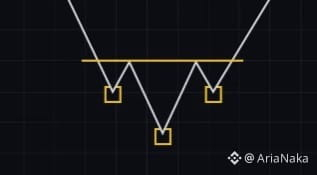
As the name suggests, this is the opposite of the head and shoulders – and as such, it indicates a bullish reversal. An inverse head and shoulders is formed when the price falls to a lower low in a downtrend, then bounces and finds support at roughly the same level as the first low. The pattern is confirmed once the price breaches the neckline resistance and continues higher.
Classical chart patterns remain relevant not because they are perfect, but because they are widely observed. In trading, perception and collective behavior often matter more than precision.
That said, no chart pattern works in isolation or guarantees success. Their effectiveness depends on market context, trend structure, timeframe, volume, and most importantly risk management.
Think of these patterns as decision-making tools rather than automatic buy or sell signals. When combined with proper confirmation and disciplined risk control, they can help traders navigate volatile crypto markets with greater clarity and consistency.

