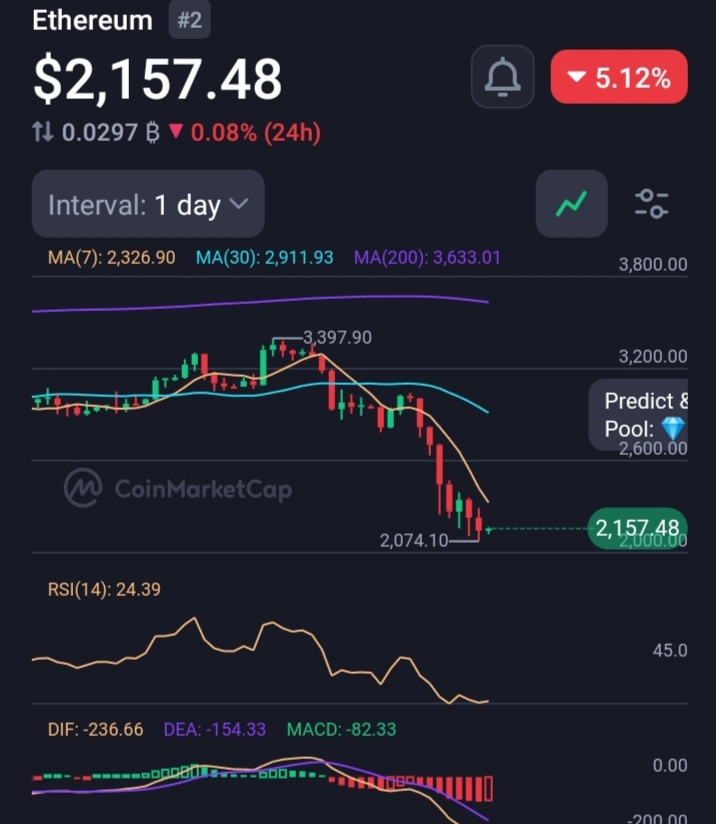
The chart shows $ETH in a strong, sustained downtrend over the past month, with price falling from above $3,800 to around $2,157.
The moving averages are aligned in bearish order:
MA(7) = 2,326.90 < MA(30) = 2,911.93 < MA(200) = 3,633.01
This indicates all timeframes are bearish, with price trading well below all key MAs.
Key Technical Indicators
1. RSI(14) = 24.39 → Oversold
· RSI below 30 signals oversold conditions.
· This suggests a potential short-term bounce or relief rally is possible.
· However, in strong downtrends, RSI can remain oversold for extended periods.
2. MACD: Bearish Momentum
· DIF: -236.66
· DEA: -154.33
· MACD Histogram: -82.33
· MACD is deeply negative and below the signal line, confirming strong bearish momentum.
Volume & Price Action
· The recent candle is green but very small, indicating weak buying interest.
· Price is testing the lower boundary of the visible range, near $2,074.10.
---
🧱 Support and Resistance Zones
· Immediate Support: $2,074–$2,100 (recent low)
· Next Major Support: $2,000 (psychological level)
· Resistance Levels:
· $2,326 (MA7)
· $2,911 (MA30)
· $3,633 (MA200 – strong long-term resistance)
Bullish Scenario (If Reversal Occurs)
· Trigger: Strong bounce from $2,074–$2,100 with increasing volume.
· Confirmation: Break above MA(7) at $2,326 and RSI rising above 30.
· Target: $2,600–$2,911 if momentum continues.
Bearish Scenario (If Downtrend Continues)
· Break below $2,074** could lead to a test of **$2,000.
· If $2,000 fails, next support lies near $1,800–$1,850 (previous major swing low).
· Continued MACD negativity and RSI staying oversold would confirm further downside.
Summary
Aspect Signal Notes
Trend Bearish All MAs descending, price below all MAs
Momentum Bearish MACD negative, histogram declining
RSI Oversold Potential for short-term bounce
Key Level $2,074 Must hold to prevent further drop to $2K
Outlook Cautious Await confirmation of support or breakdown
---
Bottom Line: Ethereum is in a strong bearish phase but is oversold on the RSI. Watch the $2,074–$2,100 zone closely. A bounce from here could offer a short-term bullish trade, but the overall trend remains down until price reclaims $2,326 (MA7).

#Ethereum #ETH🔥🔥🔥🔥🔥🔥 #ADPDataDisappoints #WhaleDeRiskETH #EthereumLayer2Rethink?