 Bitcoin is currently approaching a high-stakes technical junction on the weekly timeframe. After hitting recent highs, the price has retraced to test the confluence of long-term trendline support and horizontal demand.
📊 THE STRUCTURE OVERVIEW
Despite the recent pullback, $BTC maintains a broad higher-high, higher-low macro structure. We are now at the "make or break" zone:
Current Price: ~$67,860
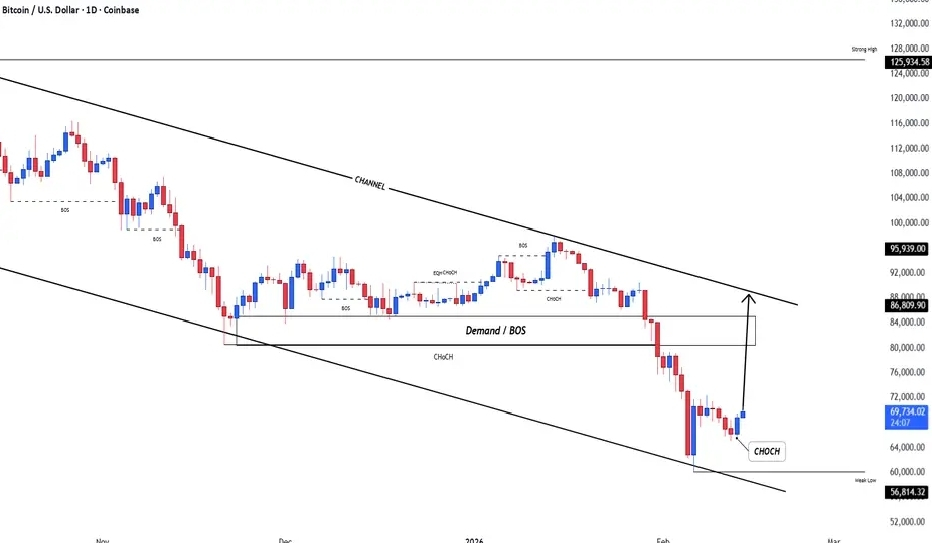
The Confluence Zone: A rising macro trendline meets horizontal support between $66k – $68k.
Momentum: The weekly oscillators are cooling down from overbought levels—a necessary "reset" for healthy price action.
🔑 KEY LEVELS TO WATCH
Zone Type Price Level Significance
Immediate Support $66,000 – $68,000 The primary defense line for bulls.
Major Demand ~$52,000 High-probability reaction area (weekly order block).
Resistance $71,900 → $78,500 Breaking above $72k re-ignites the bullish engine.
📉 TWO SCENARIOS FOR THE WEEKS AHEAD
1. The Bullish Bounce (55% Probability):
If BTC closes the week strongly within the $66k–$68k zone, it confirms the rising trendline. This keeps the macro uptrend intact and sets the stage for a push toward $78k+.
2. The Structural Reset (45% Probability):
A clean weekly close below the trendline invalidates the current bullish momentum. This would likely trigger a deeper correction toward the $52k demand zone to flush out late-cycle longs before the next major leg up.
💡 TRADING APPROACH
This is a reaction zone, not a chase zone. Patience is key—watch for a "hammer" or "bullish engulfing" candle on the weekly close to confirm that buyers are stepping in.
Remember: "Trade what you see, not what you feel." 📈
