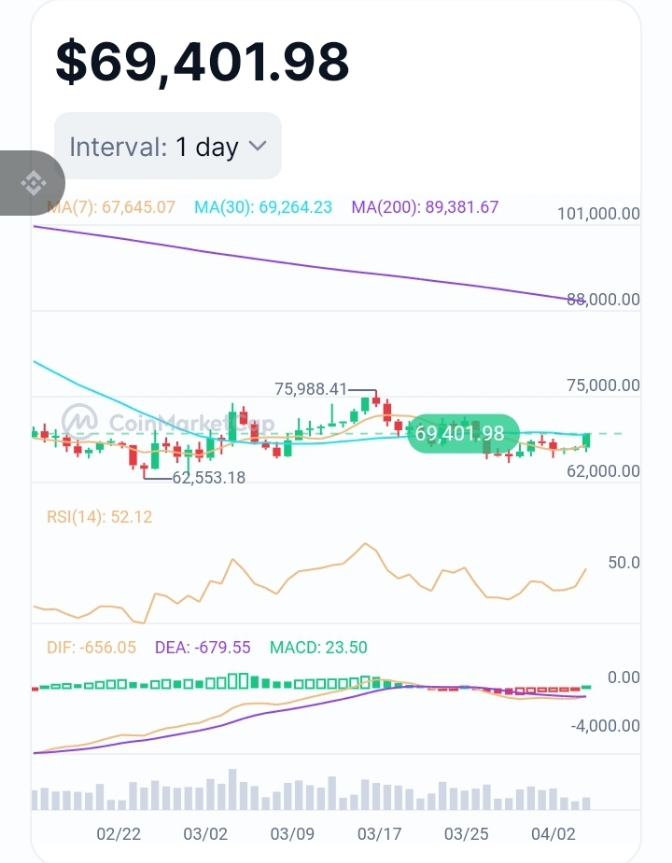
Bitcoin ($BTC ) is in a neutral but slightly bullish zone, with more range trading than clear trend right now.
Over the next month, BTC could mostly trade in a 62,000 to 78,000 range unless a major macro or ETF shock hits.
A sustained break above about 75,000 on strong volume could open a path toward the low 80,000s.
Losing support around 65,000 on heavy selling could bring retests of the low 60,000s or even the high 50,000s.
Deep Dive
1. Base Case Next Month Range
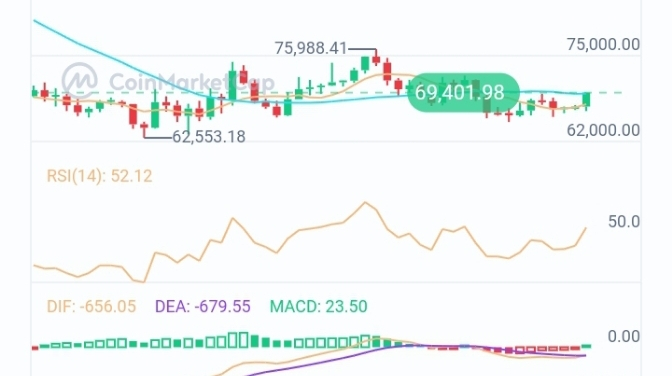
BTC is currently around 69,400 with neutral momentum and moderate fear in the market, which points to choppy trading rather than a clear breakout.
Recent data points:
Key signals behind the base case:
Price is near the 50 percent Fibonacci retracement of the recent 75,988 to 64,972 range (around 70,480), so it is sitting near a natural congestion zone.
Short term moving averages (around 67,500 to 68,000) are close to spot, RSI is near 50, so neither overbought nor oversold.
Total crypto market cap has risen slightly over the last month and BTC dominance has ticked up, which usually supports downside being bought on BTC first.
What this means: A sideways to slightly upward month is plausible, with a working range around 62,000 to 78,000 unless a big macro or ETF flow surprise appears.
2. Bullish Breakout Scenario
A bullish extension becomes more likely if BTC can clear and hold above recent highs with strong spot and derivatives activity.
Levels and conditions that could support upside:
First resistance is near 70,500, then around 73,000 to 74,000, and finally the prior high zone around 76,000 to 78,000.
Open interest has risen nicely and funding is slightly positive, so if price breaks higher with rising volume, that leverage can fuel an upside squeeze.
If that breakout holds for several days, extensions from recent Fibonacci levels suggest a possible zone in the low 80,000s as the next big area to watch.
What this means: If BTC closes convincingly above the mid 70,000s on strong volume, a move toward 80,000 to 83,000 becomes more realistic, especially if ETF inflows and macro remain supportive.
3. Bearish Pullback Scenario
On the downside, there is real risk if current support zones give way while leverage stays elevated.
Main supports and risk triggers:
Initial support sits around 69,000 then 67,000; below that, the prior swing low near 65,000 is critical.
If 65,000 breaks on high volume with rising liquidations, recent range buyers may get washed out, opening room toward the low 60,000s.
In a heavier risk off environment, especially if macro or ETF flows turn sharply negative, a deeper shakeout into the high 50,000s cannot be ruled out.
What this means: Watching how price reacts near 67,000 to 65,000, and whether selling is driven by forced liquidations, will tell you if this is just another dip or the start of a larger correction.
Conclusion
BTC is currently in a neutral to mildly bullish posture, with fear still present but dominance and open interest supporting the idea of a broad 62,000 to 78,000 trading band. Moves outside that range are more likely if we see either a strong breakout above the mid 70,000s with volume, or a decisive break below about 65,000 driven by macro or ETF outflows.
Confidence: Medium, because the direction over the next month depends heavily on macro data and ETF flows that can change quickly.
As of 6 Apr 6:18pm UTC+5 using CMC live price, CMC historical price, and CMC market overview.