The FUN/USDT trading pair currently in a significant downtrend, presenting a volatile landscape for potential price predictions. Technical indicators suggest strong bearish control, but some data points hint at potential consolidation or a short-term relief bounce.
Current Market
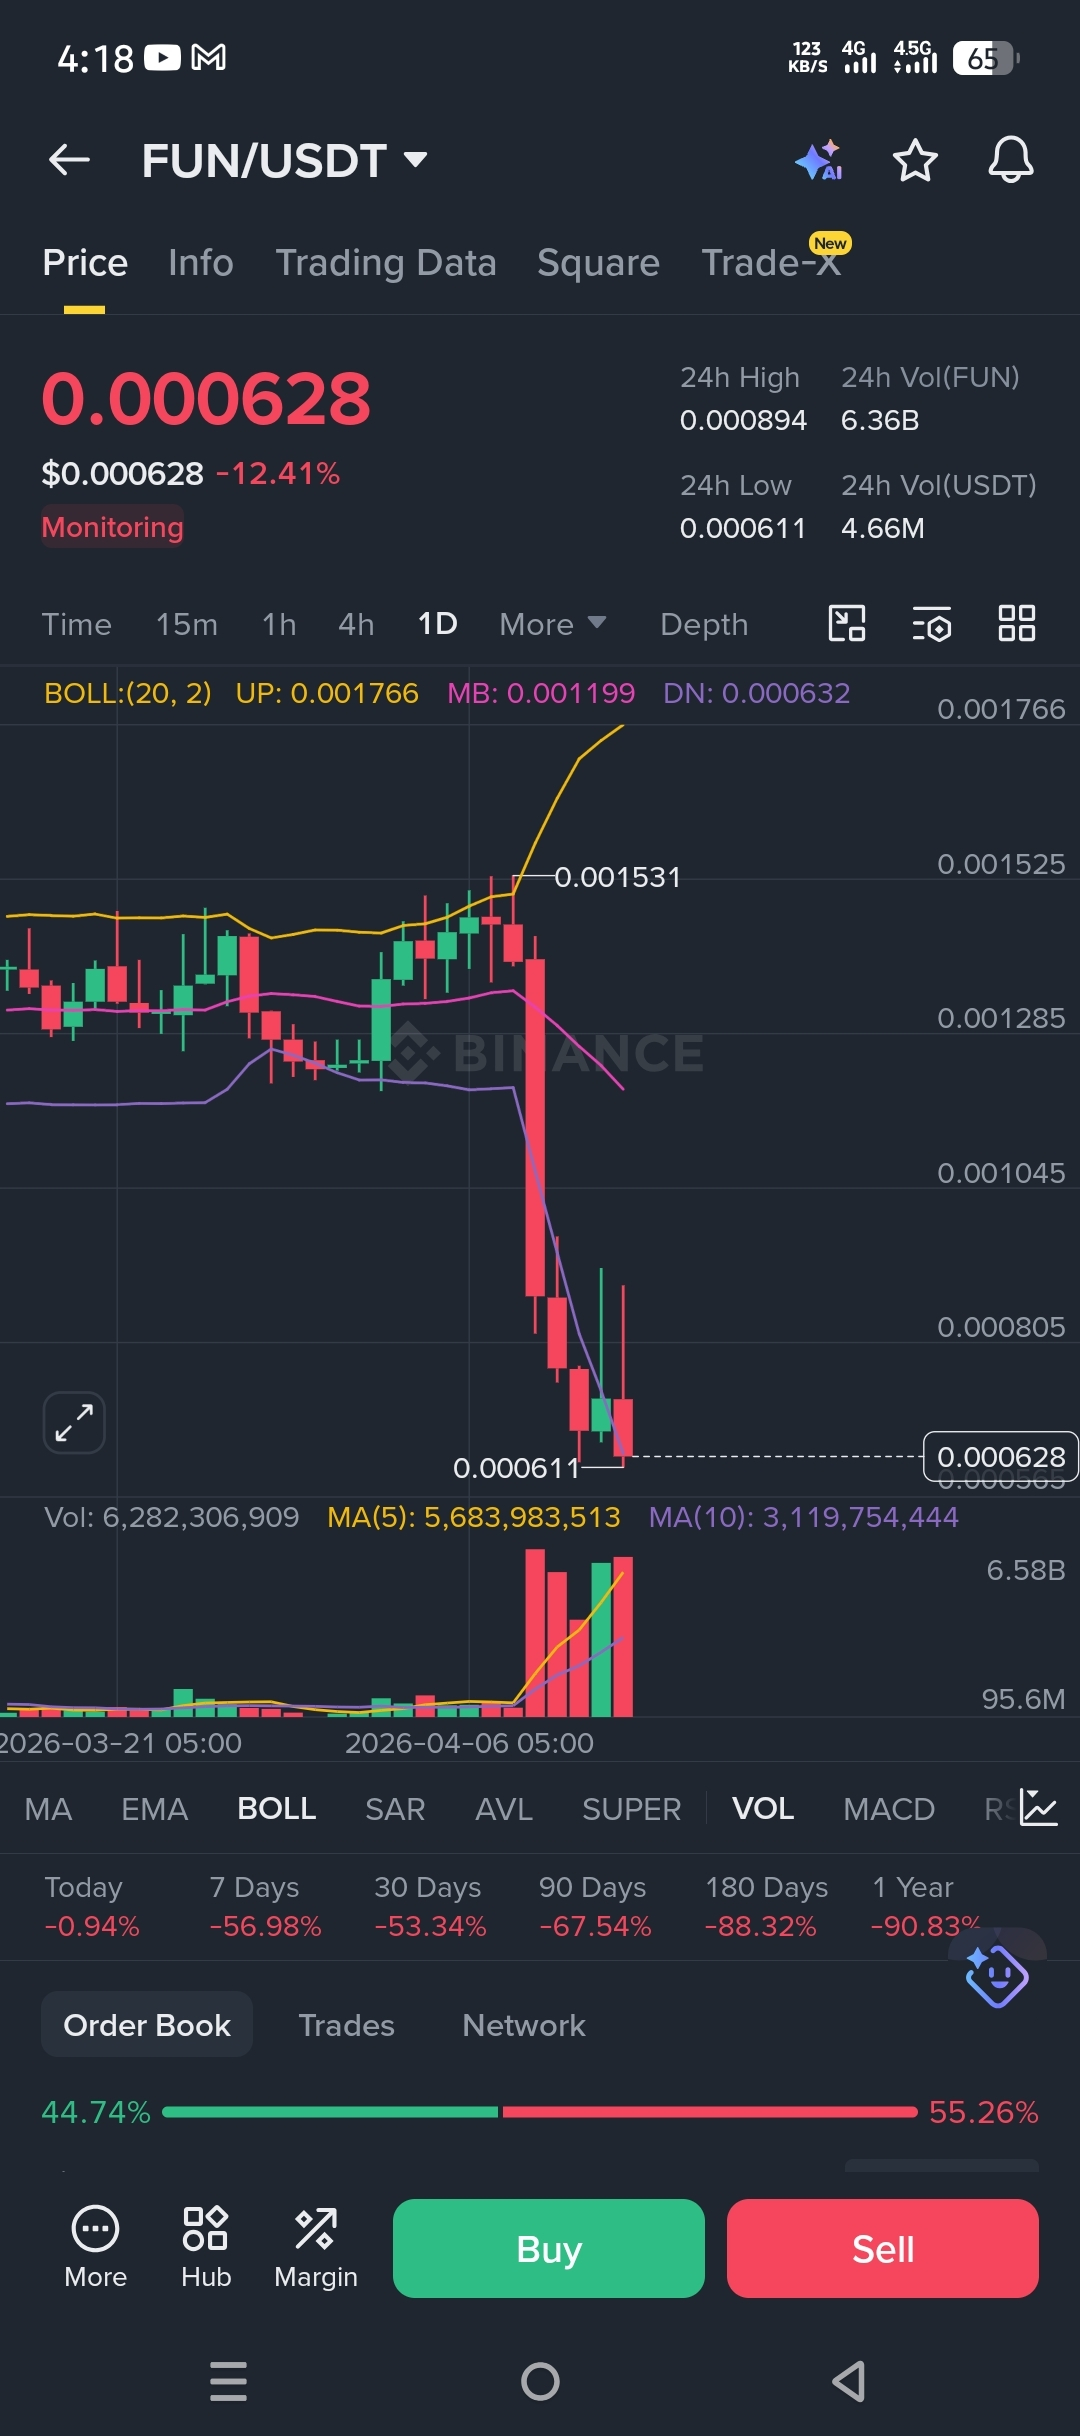
As of the time of the chart, the price of FUN is $0.000628, down -12.41% in 24 hours. Key data points include:
24h High: $0.000894
24h Low: $0.000611
24h Volume (FUN): 6.36B
24h Volume (USDT): 4.66M
The price has seen a massive drop from a recent high around $0.001531, pushing it well below key moving averages and the lower Bollinger Band (BOLL).
Analysis
Moving Averages (MA): The current price is significantly below the MA(5) and MA(10) volume lines, which act as resistance levels. This confirms the strong bearish momentum.
Bollinger Bands (BOLL): The price is touching the lower BOLL at $0.000632. Prices often tend to revert to the mean (MB: $0.001199) after touching the outer bands, which could signal a potential short-term bounce or a period of consolidation.
Volume: High volume accompanied the recent price drop, indicating strong selling pressure. However, the volume is still high, suggesting active trading and potential volatility ahead.
Performance The asset has performed poorly over longer timeframes, with a -90.83% drop over the last year, suggesting a long-term bearish sentiment.
Price Prediction and Outlook
The immediate outlook for FUN/USDT appears cautiously bearish. The strong downtrend means bears are in control, and a confirmed reversal is not yet visible.
Bearish Scenario: If the current support level at the 24h low of $0.000611 breaks, the price could continue its decline into new lows.
Bullish Scenario: The price is nearing oversold territory (implied by touching the lower BOLL band). A period of consolidation or a dead-cat bounce (short-term relief rally) might occur if buyers step in at these low prices, potentially pushing the price back towards the middle Bollinger Band.
Traders should watch for a bounce from the current support zone or a decisive break below it to determine the next major move.
((Disclaimer: ))This article is for informational purposes only and does not constitute financial advice. Cryptocurrency markets are highly volatile, and you should manage risk according to your capital and conduct your own research before trading.